.png)
 4 months ago
7
4 months ago
7
ARTICLE AD BOX

- XRP’s overbought Stochastic RSI flashes a warning, echoing past signals that led to 25% average price drops in 2025.
- Chart patterns suggest a potential 50–70% downside, but analysts remain split as some predict breakouts toward $3.70 or higher.
XRP held above the $2.28 level on July 7, recording a 0.58% price gain over 24 hours. The token peaked near $2.29 during the session before dropping, as alternating waves of buying and selling pressure shaped the intraday structure. Despite the brief pullback, XRP maintained its bullish posture after recovering from lows of $2.24.
Market capitalization rose to $134.68 billion, supported by strong inflows. The token’s trading volume jumped by 35.93% to $2.49 billion, pushing the volume-to-market-cap ratio to 1.85%. These figures reflect heightened investor participation and increased interest near current price levels. The fully diluted valuation (FDV) reached $228.02 billion, based on a maximum supply of 100 billion XRP. The circulating supply stands at 59.06 billion, limiting inflation risk and supporting market stability.
Technical charts show XRP rebounding from key support near $2.27, with bullish momentum pushing the price higher in the afternoon session. The resilience around this level reinforces its short-term strength. However, underlying indicators now point toward potential volatility ahead.
Stochastic RSI Enters Overbought Zone Again
The daily Stochastic RSI has remained in overbought territory above 80 since June 28. This indicator compares XRP’s relative strength index (RSI) to its recent range, often signaling momentum exhaustion at elevated levels. Past behavior suggests that when this metric normalizes from overbought conditions, sharp price reversals tend to follow.
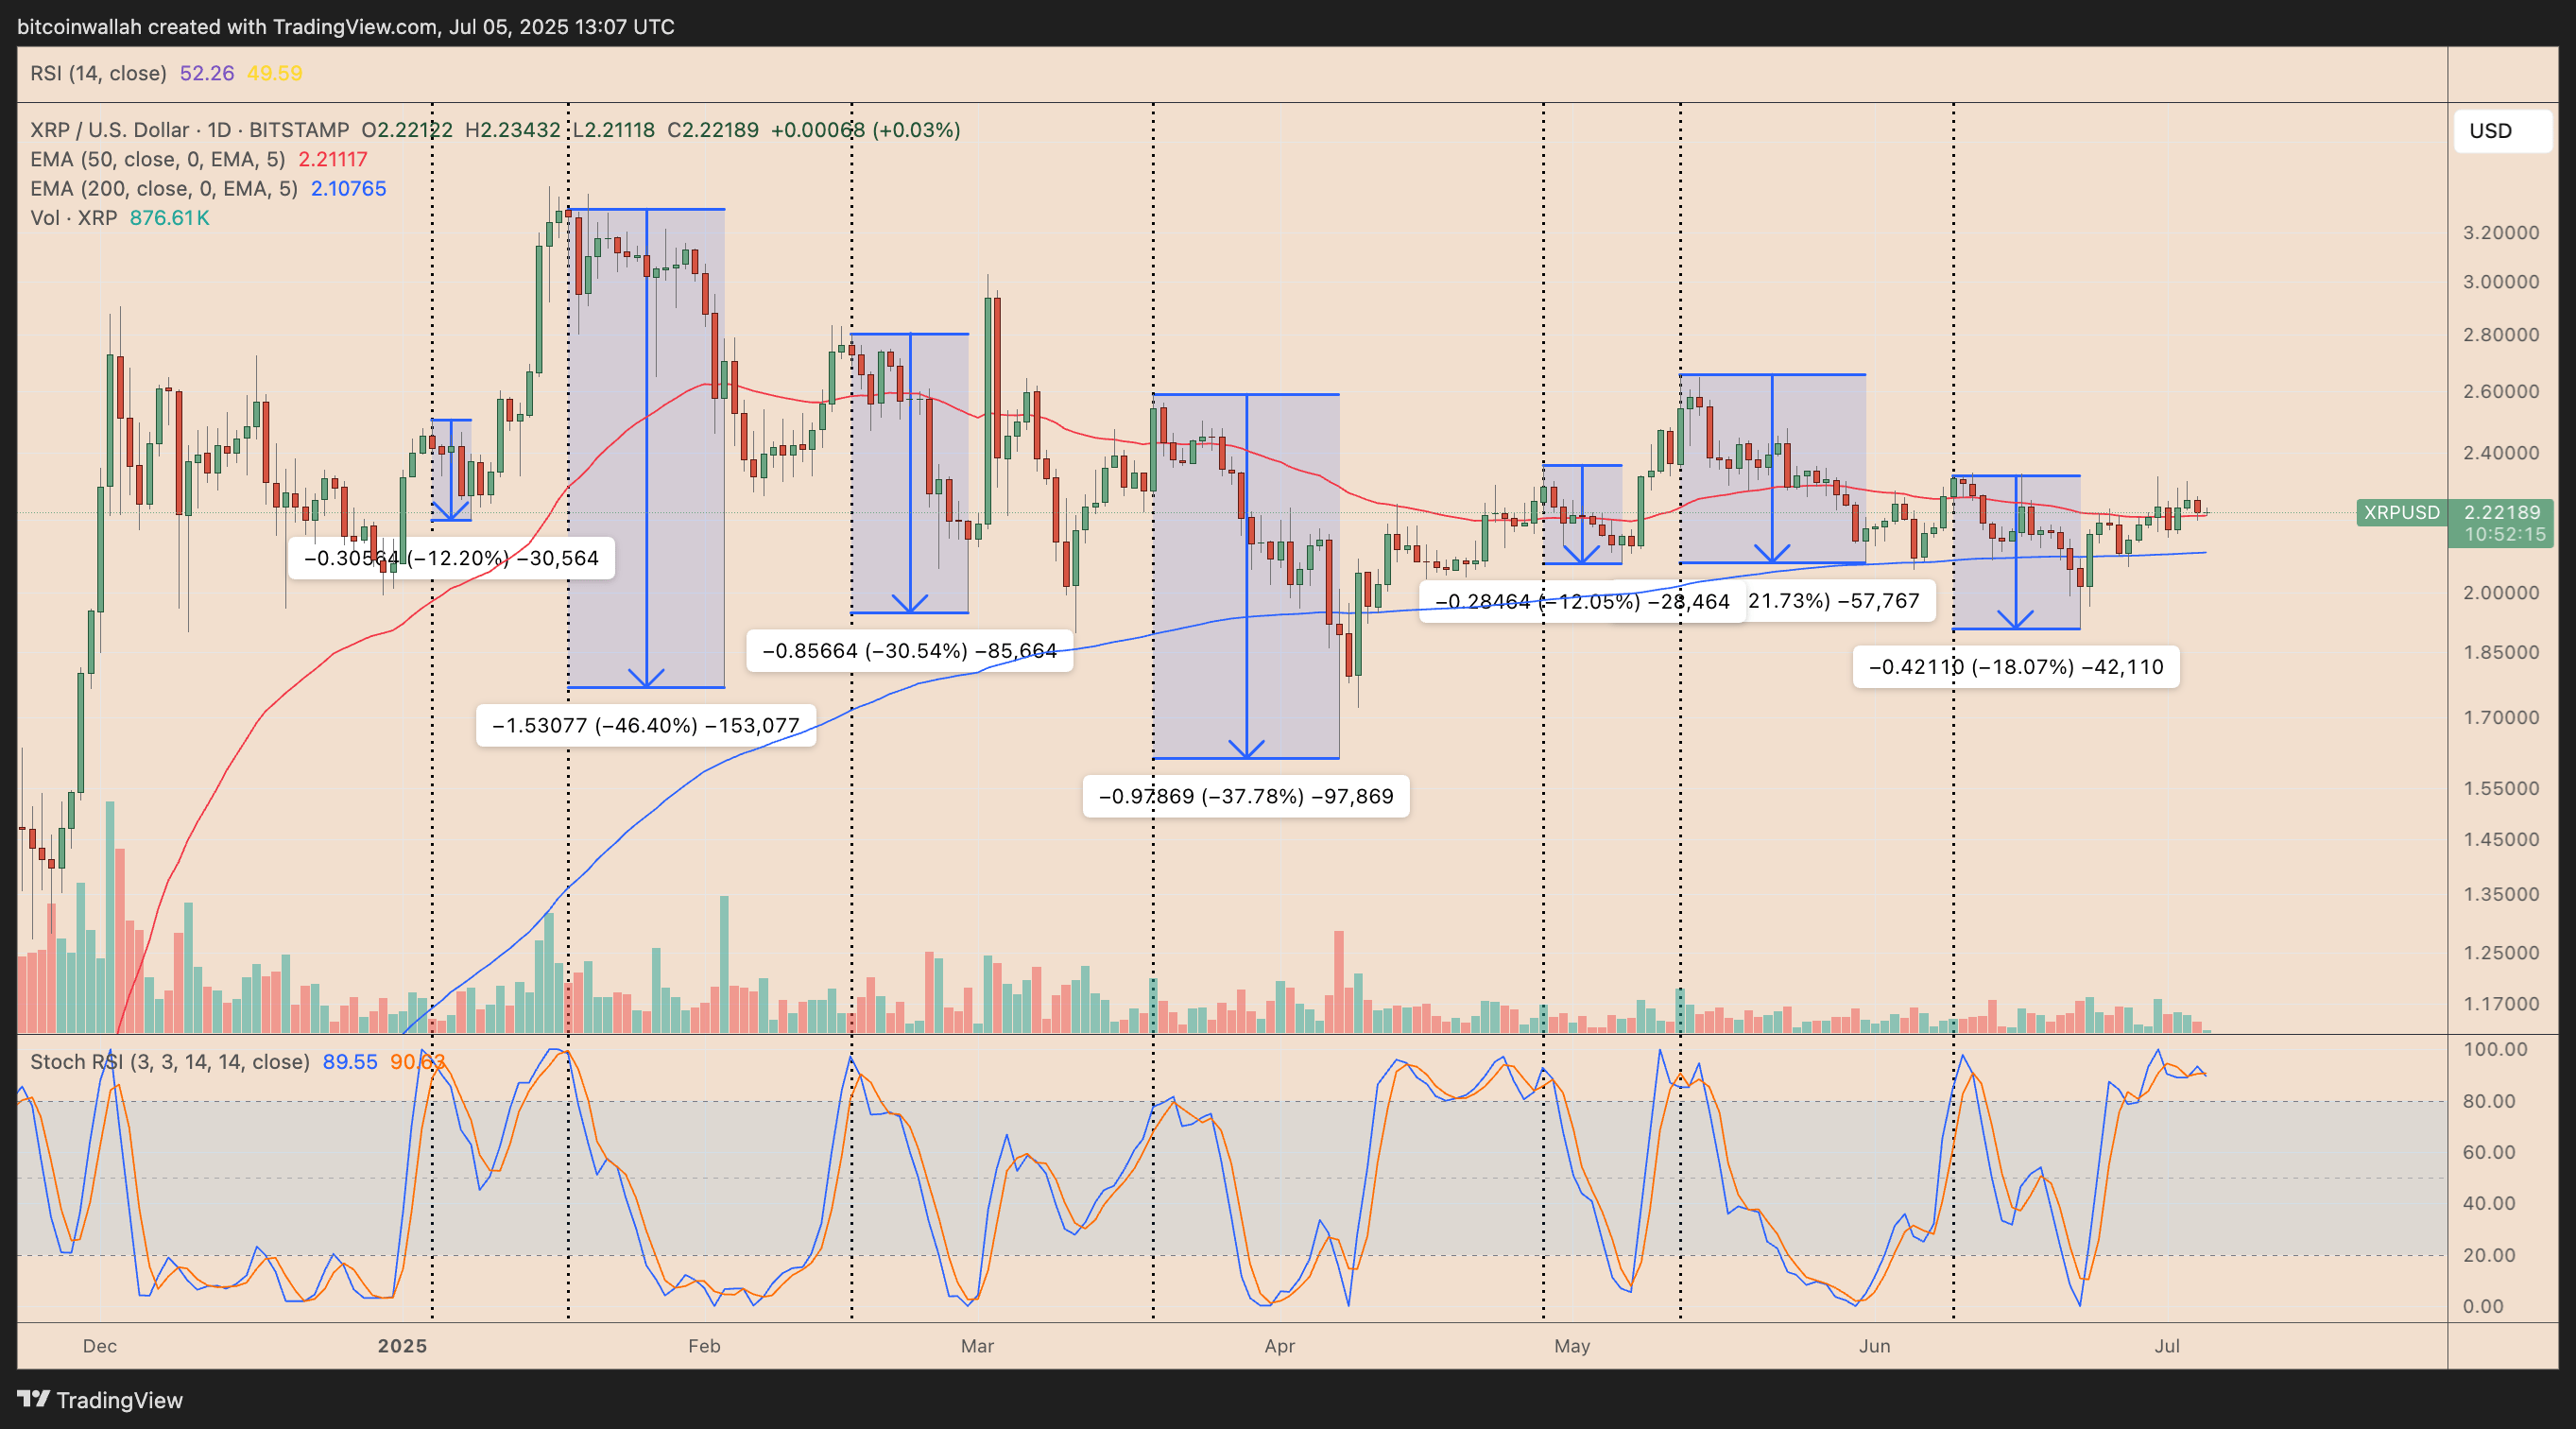 Source: TradingView
Historical patterns from 2025 show XRP experiencing declines of 12% to 45% after similar RSI conditions. On average, those drawdowns measured around 25%. With the Stochastic RSI flashing the same warning again in July, market observers are watching closely for signs of a pullback. The setup mirrors previous local tops, increasing the risk of correction unless volume-driven upside breaks key resistance levels.
Chart Patterns Signal Potential 50–70% Downside Risk
A descending triangle formation is taking shape on XRP’s price chart following its recent rally. This pattern typically favors bearish outcomes when lower highs compress against horizontal support. If the structure plays out, a measured move projects downside targets near $1.14, about 50% below current levels.
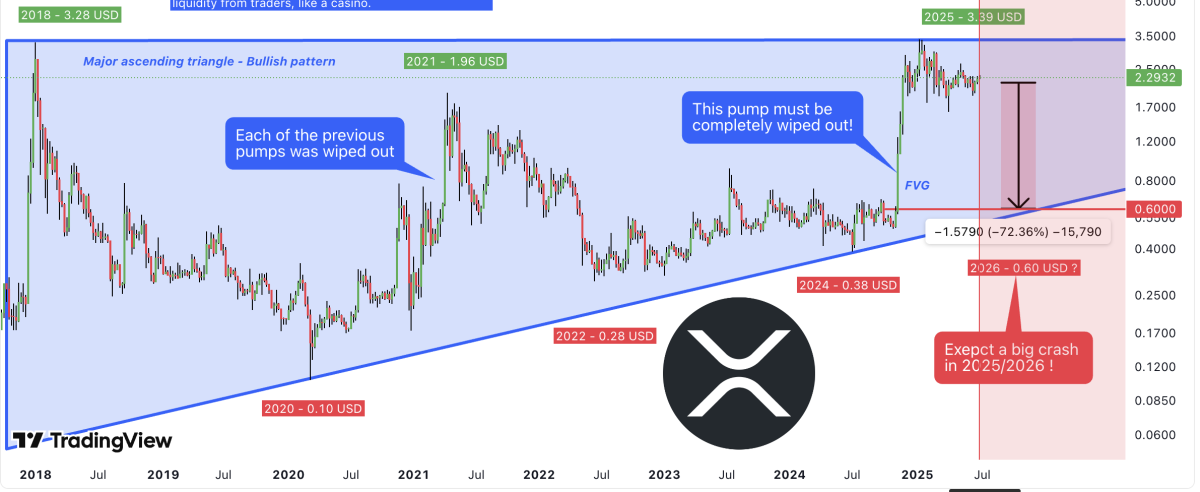 Source: TradingView
Analyst Xanrox has expressed concern about a deeper correction based on a multi-year ascending triangle that has defined XRP’s price action since 2017. His analysis highlights a large Fair Value Gap (FVG) created during XRP’s vertical move to $3.40 earlier in 2025. According to his projection, a full retracement to $0.60 could occur if this FVG is filled, implying a near 70% drawdown.
Mixed Forecasts Amid Bullish Breakout Hopes
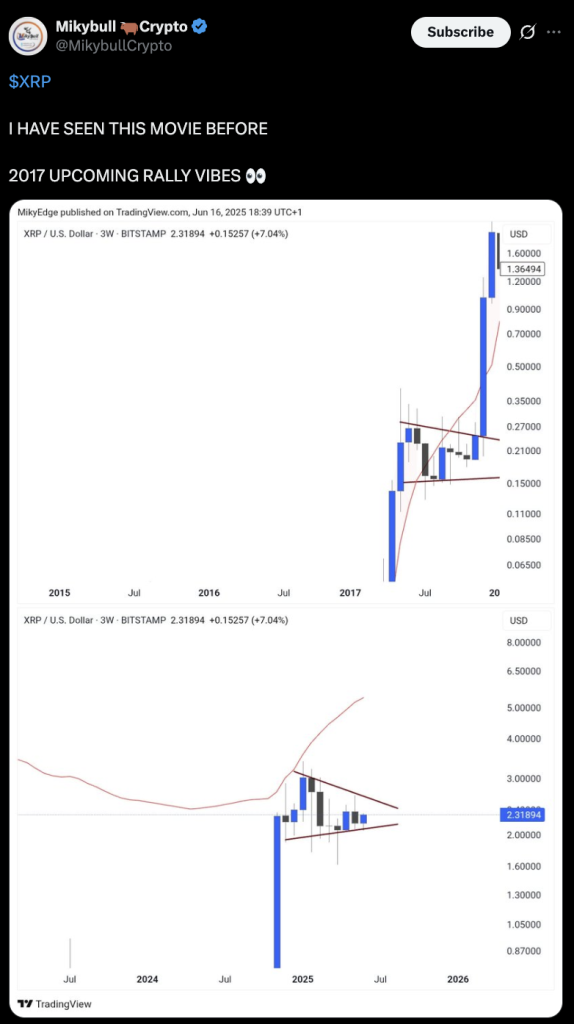
Despite these warnings, several analysts maintain a bullish view. Mikybull Crypto sees a symmetrical triangle forming, targeting $3.70 by September. XForceGlobal offers a wide projection range between $8 and $27 using Fibonacci extension levels. Others point to whale accumulation and a possible falling wedge breakout that could lift XRP toward $3.20.
While the overbought RSI raises near-term caution, overall sentiment remains divided. A sustained move above $2.30 could invalidate the bearish setup. Until that occurs, traders may remain cautious as volatility looms.


 English (US)