.png)
 1 month ago
3
1 month ago
3
ARTICLE AD BOX

- Stellar shows signs of a bullish breakout with analysts spotting wedge and inverse head-and-shoulders patterns, hinting at upward momentum.
- Despite recent price dips, rising volume near support zones and technical breakouts point to a stronger rally building ahead.
Stellar (XLM) is gaining fresh traction with its setup of the bullish signals for the next rally. In the past week, however, the token has endured a total decline of 4.40%, with its 24-hour trading volume declining by just 6% to reach $143.77 million. In spite of the current weakness, experts foresee the potential for the token to move significantly higher following months of stabilization of its price.
 Source: TradingView
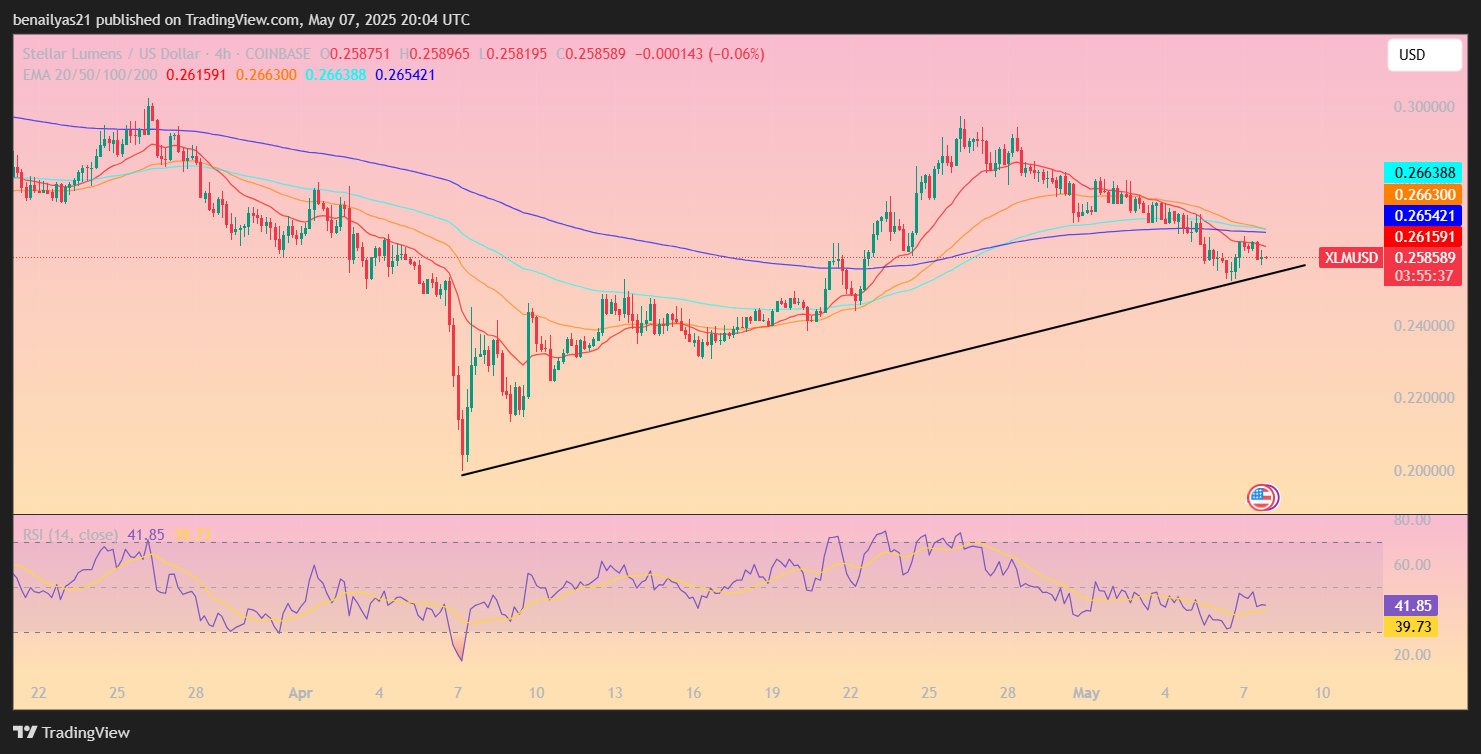
One of the significant changes to come was noted by crypto analyst VipRoseTr, who identified a breakdown from the falling wedge pattern on XLM’s 24-hour candle chart. Price action passed through the upper border of the wedge and came back to test the $0.25–$0.27 accumulation level.
 Source: VipRoseTr
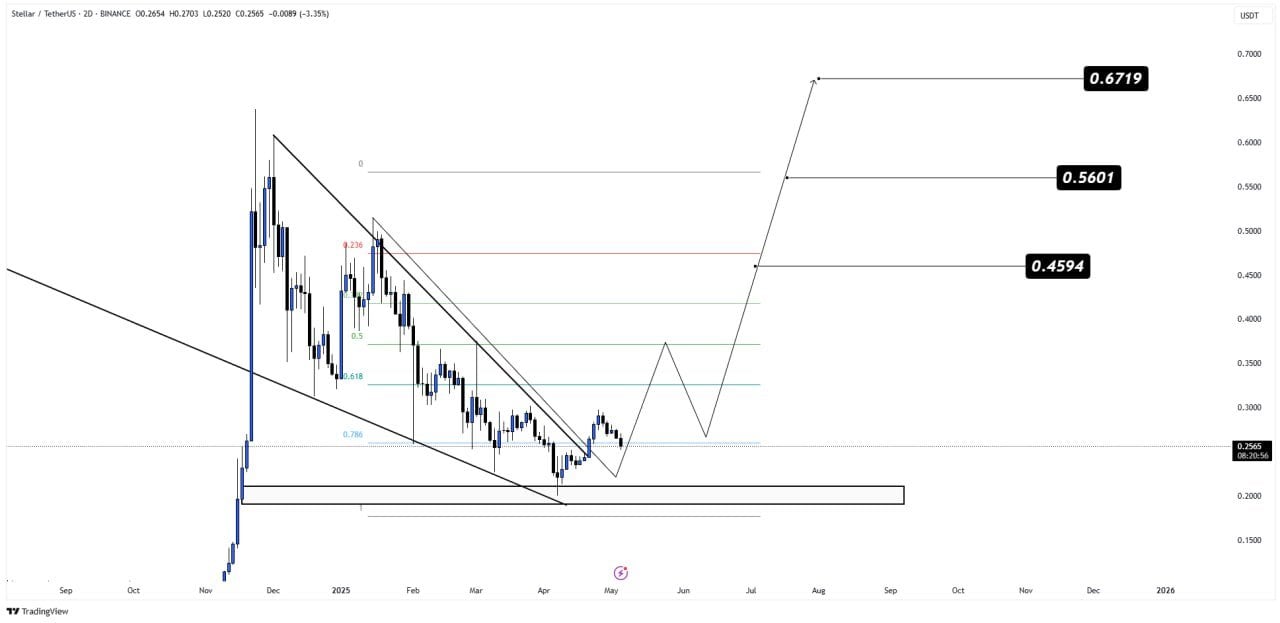
VipRoseTr pointed to the development of the higher low, indicating market sentiment is shifting in favor of the buyers. The technical study set out targets of $0.46, $0.56, and $0.67—levels corresponding to historical resistance levels and Fibonacci levels.
VipRoseTr highlighted risk management in this configuration, suggesting the placement of a stop-loss at $0.1980. This is below both the base of the wedge and the current swing low and acts as protection if the market reverses. It was said by the analyst that using leverage of between 5x and 10x might add to returns, but this does increase the risks involved for traders.
Stellar’s Bullish Pattern Signals Breakout — Key Targets
A different view was offered by crypto analyst Ali Martinez, noting a sign of an inverse head and shoulders pattern in XLM’s 4-hour chart. Per Martinez, both the left shoulder, the head, and the right shoulder are well formed, with the token sitting at $0.257 at the time of writing. Major levels of Fibonacci retracements noted include 0.618 at $0.255 and 0.786 at $0.273, which represent areas of likely support.
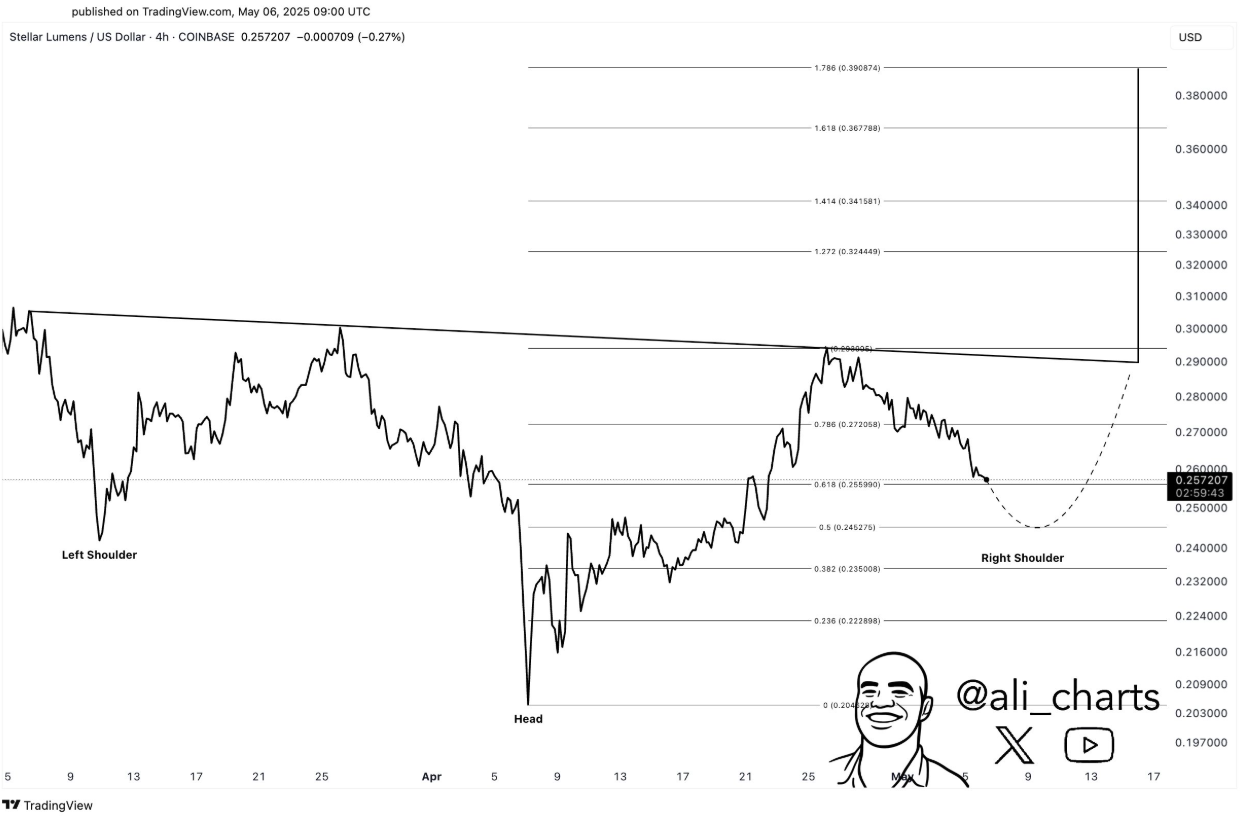 Source: Ali Martinez
Martinez said if the support level at $0.24 is maintained, Stellar might finalize the right shoulder formation, preparing the ground for its breakout above the neckline at around $0.29. An extra set of Fibonacci extension levels were given at $0.324 (1.272), $0.341 (1.414), and $0.367 (1.618), with the wider projection targeting the level at $0.390 (1.786).
Martinez asserted that market players are very much watching for confirmation of the bullish breakout in the near term.
In the larger context, Analyst Crypto Target pointed out that Stellar was finally able to exit from its long-term descending channel from December 2024 to early May 2025. This breakdown led XLM to rise from about $0.26 to nearly $0.50, as price action charged with increased strength into the premium resistance area pointed out in the chart study. Buyers are taking control with growing strength as the momentum approaches the $0.50 level, according to Crypto Target.
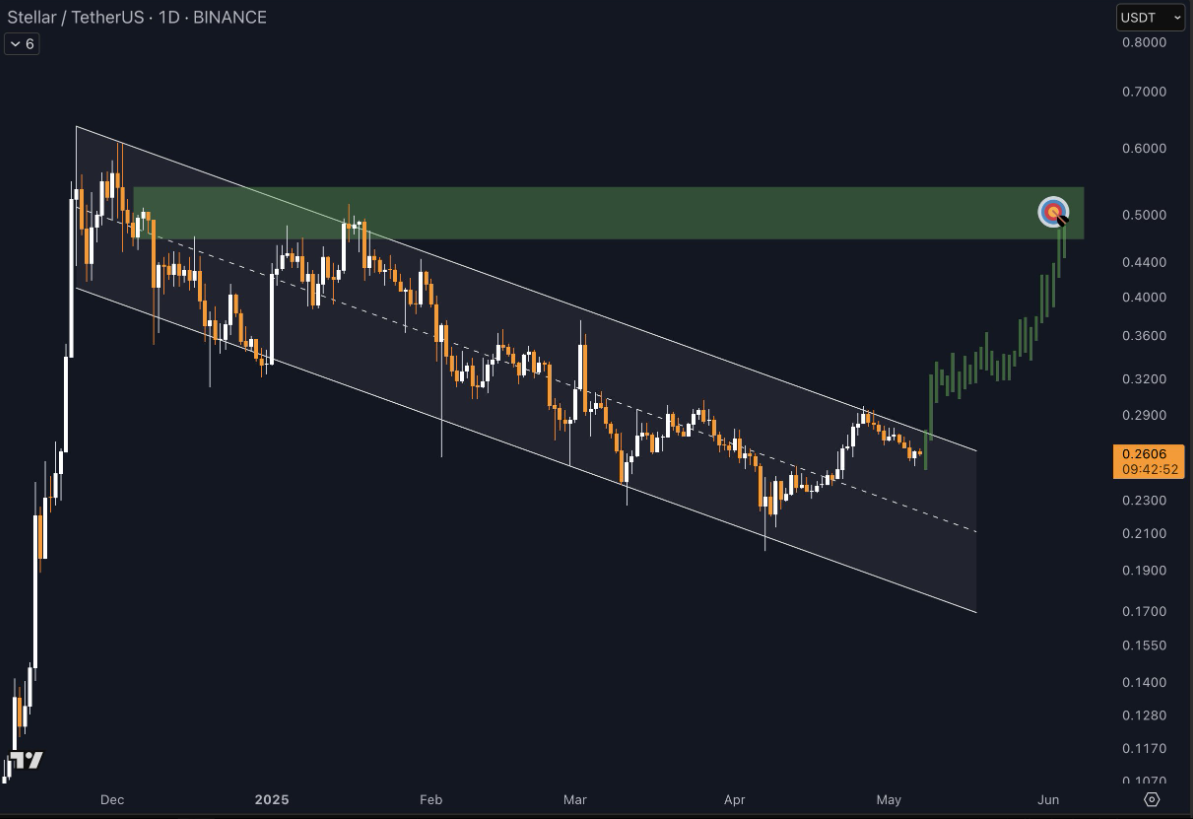 Source: Crypto Target


 English (US)