.png)
 3 hours ago
2
3 hours ago
2
ARTICLE AD BOX

- Tron shows steady selling pressure with falling TVL and shrinking futures interest among traders.
- Technical readings signal sellers’ control, with price below major averages and momentum fading further.
Tron (TRX) traded at $0.2830 on Tuesday, extending its pressure after a 5% decline on Monday. Market data shows the token is approaching a key support level near $0.2764. On-chain and derivatives metrics indicate weakening demand and declining investor confidence.
According to DeFiLlama, Tron’s Total Value Locked fell by about 6.32% over the past 24 hours, dropping below the 5 billion dollar mark to around 4.8 billion. The decline suggests ongoing withdrawals from the DeFi ecosystem and points to waning engagement among network participants.
Open interest in TRX futures also dropped by 4.48% over the past 24 hours, sliding to around $291 million. The fall suggests a cutback in leveraged positions as traders reduce risk exposure. This reduction signals a sharp decline in speculation and participation within the derivatives market.
If the decline in derivatives and on-chain activity continues, the market’s value could drop further. Short-term conditions show strong bearish momentum, confirmed by technical indicators that signal weakening strength.
Indicators Point Toward Continued Weakness
Technical analysis shows the current price is trading below the 200-day Exponential Moving Average (EMA) at $0.3029. The 50-day EMA has also crossed below the 100-day EMA, a formation known as a death cross. This usually points to ongoing bearish pressure, which suggests that short-term sellers still have the upper hand.
On the daily chart, momentum indicators are showing signs of pressure. The Relative Strength Index (RSI) is at 26, clearly reflecting an oversold level with a downward direction. This setup points to heavy selling and weak recovery attempts.
The MACD indicator has dropped below its signal line, marking the third time since early October. This repeated crossover points to growing sell pressure. At the moment, sellers appear to have stronger control over market direction.
Chaikin Money Flow (CMF) is currently below the zero line at -0.09, showing steady outflow and weak buying pressure. Parabolic SAR dots appearing above the candles also indicate a downward trend and low investor confidence.
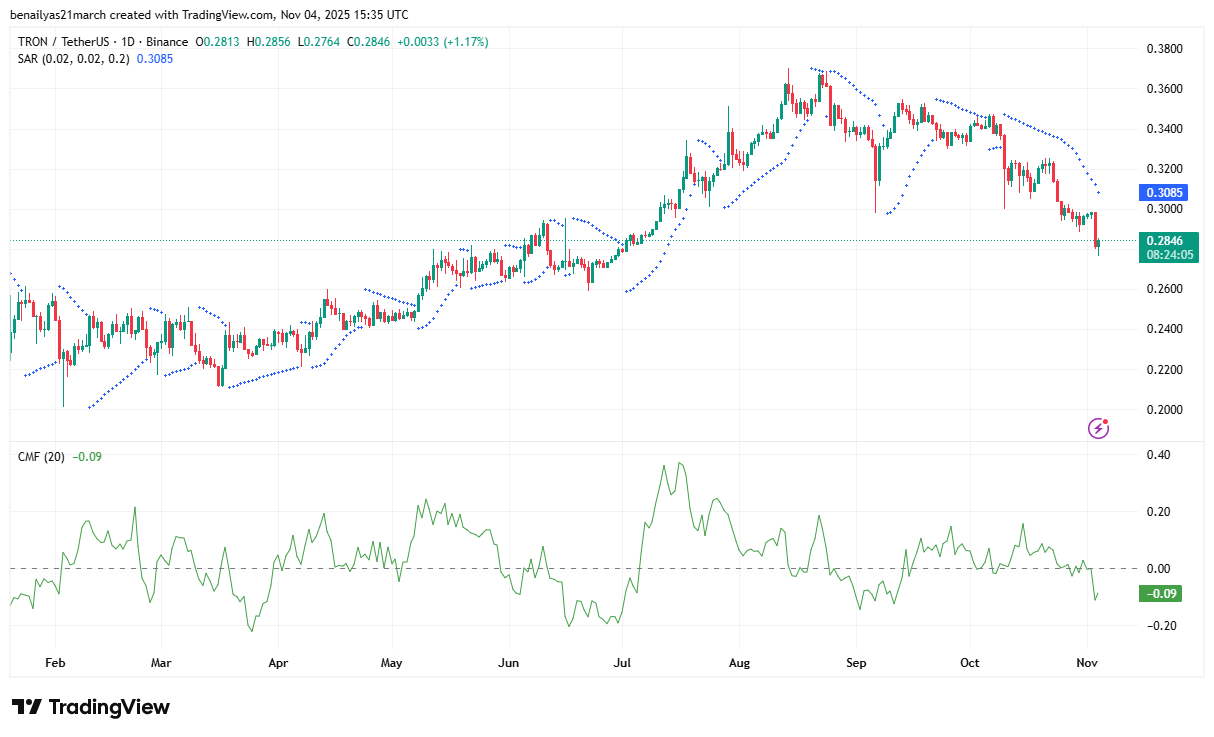 Source: TradingView
Tron Near Key Levels That Could Shift Trend
If the current downward pressure breaks below the $0.2764 support, traders may look toward $0.2632 and $0.2397 as the next targets. These levels match the lows from May 31 and April 18. A drop below these levels could trigger a deeper decline and strengthen the selling trend further.
If Tron shows a short-term bounce from $0.2764, resistance could appear near $0.2967. The 200-day EMA sits around $0.3029. These levels may cap the upside unless stronger buying pressure steps in. Bulls need clear volume support to push past these barriers and confirm a sustained recovery.


 English (US)