.png)
 3 months ago
10
3 months ago
10
ARTICLE AD BOX

- Shifts in U.S. monetary policy, including a weakening dollar, potential interest rate cuts, and rising tariffs, are expected to fuel a broader rally in risk assets like Bitcoin.
- Institutional interest in BTC continues to rise, with spot ETFs capturing 70% of gold’s YTD inflows.
Bitcoin’s bullish momentum in July has reignited discussions around its long-term trajectory, with analysts pointing to mathematical trend models and macroeconomic shifts as potential indicators of a parabolic surge.
Among these models, the Power Law Time Contours seems to take hold, which is a pricing model that draws on the exponential route that Bitcoin has been taking over time.
How the Power Law Works In the Case of Bitcoin Price?
The pseudonymous analyst ‘apsk32’ spent time showing how the historical behavior of Bitcoin closely fits a power curve, and violations of this behavior repeatedly foreshadowed big market tops. In their analysis, Bitcoin currently trades significantly above its long-term power curve, a situation that marked the beginning of blow-off tops.
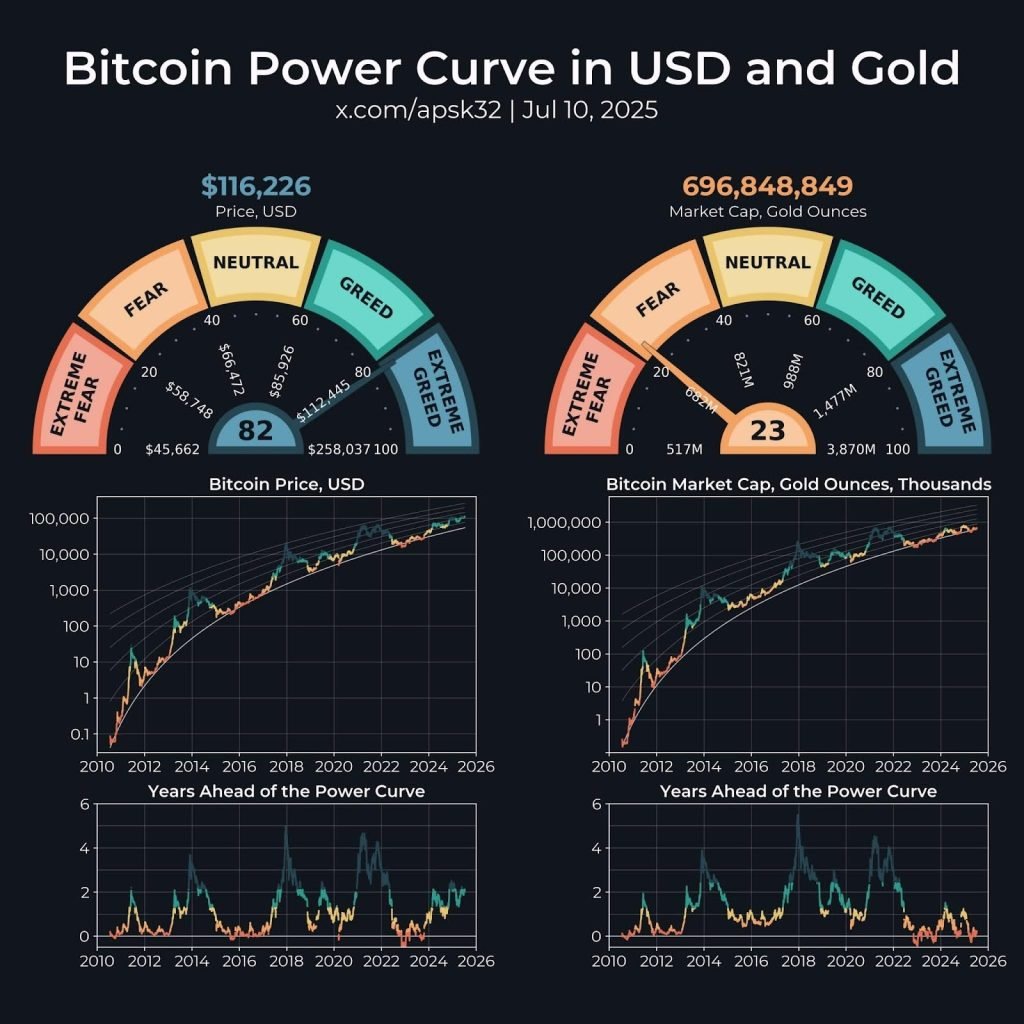 Bitcoin Power Curve in USD, gold. Source: apsk32/X
“We’re currently above 79% of the historical data using this metric,” the analyst noted. He noted that this region is approaching the “extreme greed” zone. That zone, spanning between $112,000 and $258,000, has marked Bitcoin’s euphoric peaks in 2013, 2017, and 2021. Apsk32 added,
These are the blow-off tops that come around every four years.
The analyst made it clear that the price was over the years and two points above the trendline, underlining it. “If the price stayed flat, it would take over two years for the trendline to catch up,” they said.
According to the four-year cyclical trend that is noticed during the market cycles in BTC, the analyst states that BTC price can be in a climactic period. He expects the price to grow to $200K-$300K before December this year.
Macroeconomic Indicators Surrounding BTC
Macro indicators are supporting this story, too. Satraj Bambra, the CEO of Rails, a perpetual trading platform, cited the trend toward the changing position of the U.S. Federal Reserve as a primary factor.
He singled out a possible shift in monetary policy (a weakened dollar, increased tariffs, and new leadership at the Fed) as a force that would trigger a wider surge in risk-sensitive assets like BTC, as reported by CNF. Bambra also identified both monetary expansion and a lower interest rate regime as critical catalysts to propel Bitcoin price into the greater $300K-500K range.
Meanwhile, institutional trust towards Bitcoin is gaining force. According to Econometrics, spot BTC ETFs have already hijacked 70% of the year-to-date inflows gold saw, which is a clear indication that investors now treat Bitcoin as a store of value.
Jurrien Timmer, who directs the Global Macro department at Fidelity, added a turning point in performance metrics. As he mentioned, the risk-adjusted returns of Bitcoin are narrowing in on that of gold. Thus, he believes that “the baton has swung back to Bitcoin.”
BlackRock’s IBIT Bitcoin ETF is leading the surge. It surpassed $80 billion in assets under management (AUM) this week, becoming the fastest ETF to achieve this feat in just 374 days. Amid these strong inflows, BTC price touched a high of $113,000, showcasing the growing influence of institutional influx.
At the time of press, Bitcoin (BTC) is trading for $117,800 after a marginal change in the last 24 hours. In the past 7 days, the largest cryptocurrency by market cap has recorded a nearly 10% increase.


 English (US)