.png)
 16 hours ago
2
16 hours ago
2
ARTICLE AD BOX
The post How Low Can Bitcoin, Ethereum, and XRP Prices Go? appeared first on Coinpedia Fintech News
The crypto market today has faced the wrath of geopolitical tensions and monetary policies. The recent Israel-Iran war news has led to the market cap of the business dropping by 2.51% to $3.37 trillion. This fall in numbers was catalyzed by $1.14 billion worth of liquidations. Amidst this downturn, the top-tier cryptos, namely Bitcoin, Ethereum, and XRP prices have taken a substantial hit. In this price analysis, I will walk you through the plausible future of these cryptocurrencies.
Bitcoin (BTC) Price Analysis:
Bitcoin is currently priced at $104,777.84, down 2.79% on the day. With a massive surge in 24-hour volume by 28.85% to $69.67 billion, the rising sell volume signals a panic-induced liquidation.
The daily chart shared by me highlights that the RSI hovers at 48.85, indicating waning bullish momentum. The price has slipped below the 20-day SMA at $106,454, and a rejection from the middle Bollinger Band confirms the dominance of bears. The support zone at $101,909 is critical. If breached, I believe BTC price could plunge to the psychological mark of $100,000, which also aligns with the lower Bollinger Band.
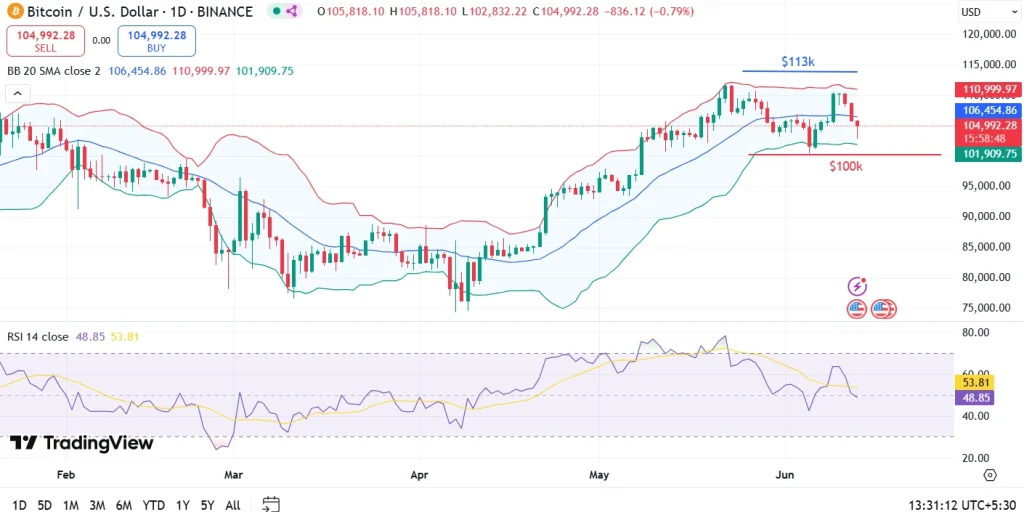
That being said, the upside potential remains capped near $113,000, unless macro conditions improve significantly. Until then, traders may expect sideways to downward movement with a bearish bias.
Also read: Bitcoin (BTC) Price Prediction 2025, 2026-2030!
Ethereum (ETH) Price Analysis:
Ethereum price has faced a heavy correction, and is down 7.83% to $2,531.74. As a result, the market cap has shrunk to $305.38 billion. The 30.82% rise in volume at $39.09 billion hints at further short-term capitulation.
The RSI has dropped to 49.43, nearing neutral but pointing downwards. It is worth noting that the ETH’s candle has decisively broken below the midline of the Bollinger Bands at $2,593, now testing the lower range at $2,404.
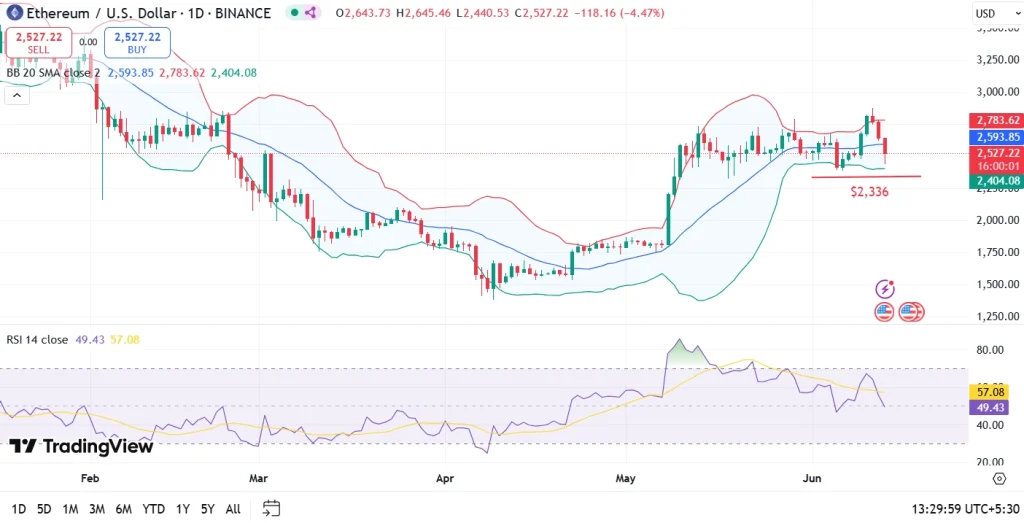
I believe the last line of defense stands at $2,336, a key support level from the chart. A daily close below that could open room toward $2,200. Recovery will face resistance at $2,783, the upper Bollinger band. Until bulls regain strength above the 20-day SMA, the downside risk remains a concern.
Check out our Ethereum (ETH) Price Prediction 2025, 2026-2030 Now!
Ripple XRP Price Analysis:
XRP has been under my watch for quite some time now, and it has plunged by 5.08% to trade at $2.12, with its market cap now at $125.26 billion. It’s battling to hold above $2.09, the daily low, and sees its resistance at around $2.35.
On the technical side, the RSI sits weak at 41.37, suggesting sellers are in control. The price has broken below the 20-day SMA of $2.22, with the next support at $1.9645, marked on the chart. Breaking this zone may bring further decline toward $1.85.
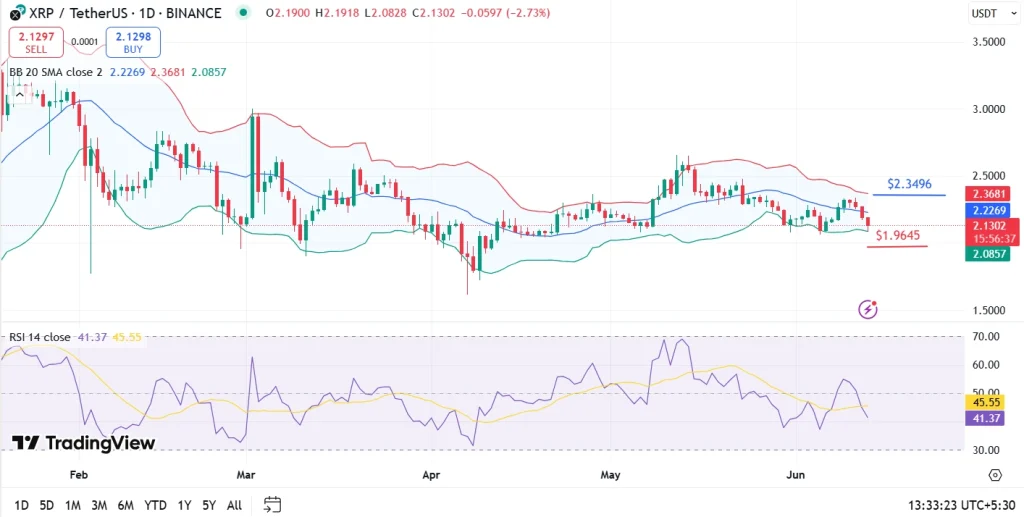
That being said, for any notable rebound, XRP needs to reclaim the 20-day SMA and push toward $2.3496, but the current structure leans bearish.
If you are an XRP hodler, you should not miss out on our Ripple XRP Price Prediction 2025, 2026-2030!
FAQs
Yes, if the market sentiment deteriorates and the $101,909 support fails, BTC price may revisit the $100k psychological level.
If ETH breaks below $2,336, it could slide further toward $2,200, especially if broader market sentiment worsens.
Not yet. With the RSI under 45 and price nearing a key support at $1.96, it’s better to wait for confirmation of reversal before buying.


 English (US)