.png)
 1 day ago
7
1 day ago
7
ARTICLE AD BOX
- Key metrics, including the 2023 Rainbow Chart, RSI levels, and the 200-week Moving Average Heatmap, signal that Bitcoin is far from its peak.
- Data from CryptoQuant shows that long-term holders are capitalizing on recent price dips to accumulate more BTC.
Bitcoin (BTC) price is once again showing strength and holding firmly above $110,000, with bulls looking for a further push to new all-time high and price discovery zones. The BTC community is also buzzing with activity amid reports of Trump media raising over $3 billion to fund their Bitcoin purchases.
But apart from these momentary catalysts and news, on-chain indicators highlight fundamental strength in BTC at this point, clearly indicating that we are still not at the peak of the current bullish cycle.
1. Bitcoin Price Can Hit $200K This Cycle As Per This Rainbow Chart
The $200,000 target is derived from the 2023 iteration of the Rainbow Chart, a long-term valuation model that uses a logarithmic growth curve to project Bitcoin’s potential price trajectory. According to this prediction, Bitcoin is only midway through its current cycle.
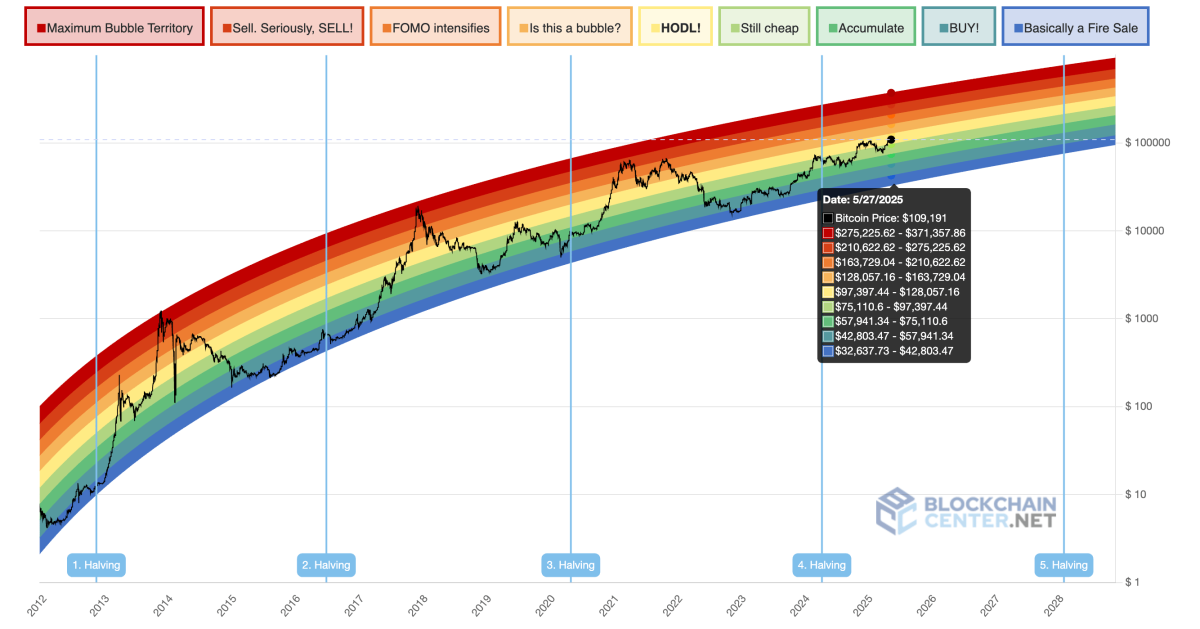 Source: Blockchain Center
2. BTC Relative Strength Indicator (RSI) Shows Room To Grow
As of now, Bitcoin’s relative strength indicator (RSI) is sitting at 71.5. Usually, an RSI above 70 indicates overbought conditions for an asset, suggesting that the price might soon decline. On the other hand, an RSI under 30 shows oversold conditions.
Bitcoin is currently in a slightly “overbought” zone but remains below the levels seen at historical peaks. BTC usually hits its peak when the RSI exceeds the 90 mark.
 Source: Bitbo
3. BTC 200 WMA Shows Optimism
The 200-week Moving Average (MA) Heatmap for Bitcoin currently sits in the blue zone, indicating that the cryptocurrency’s price has not yet reached its peak. Analysts suggest this may present an opportune moment for investors to hold or accumulate more BTC. Furthermore, Bitcoin MVRV also hasn’t peaked, showing room for further price growth.
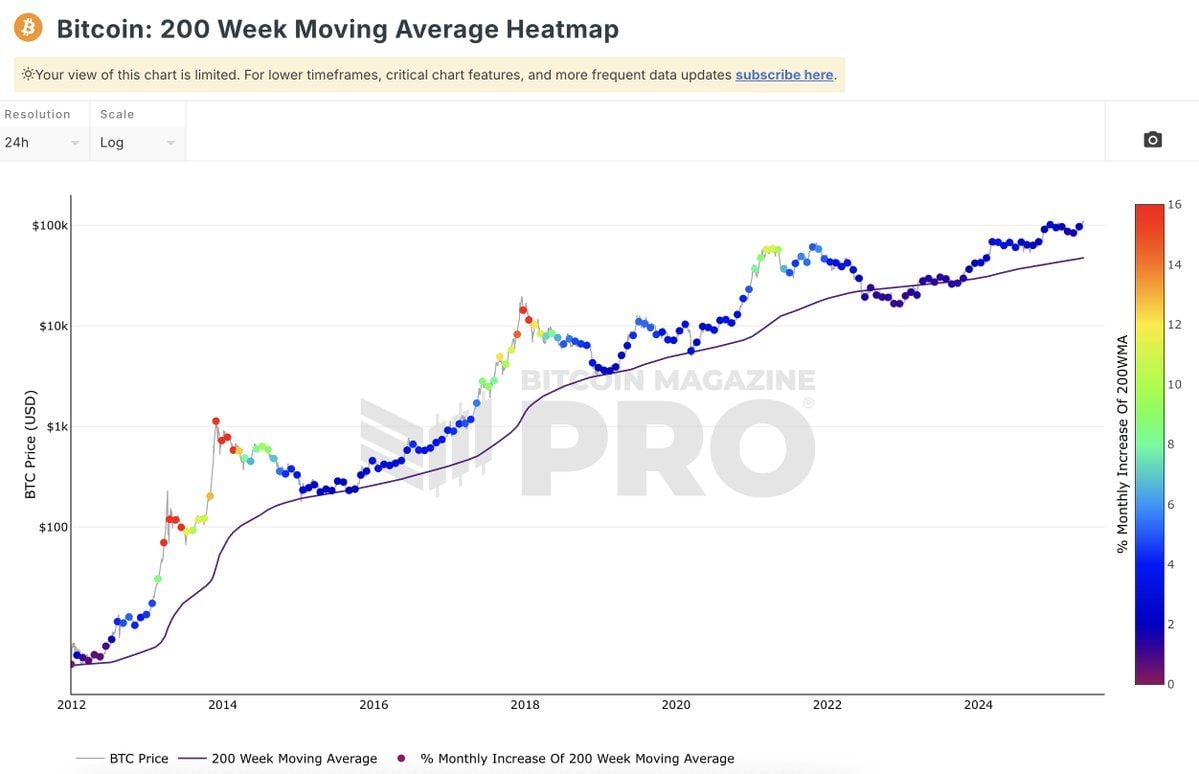 Source: Bitcoin Magazine
4. Bitcoin Price Update: 2-Year MA Multiplier Indicates Further Growth
The 2-Year Moving Average (MA) Multiplier places Bitcoin’s current price between the red and green bands. Since the price has not yet reached the red line, analysts conclude that the cryptocurrency market is still far from its peak, signaling potential for further growth.
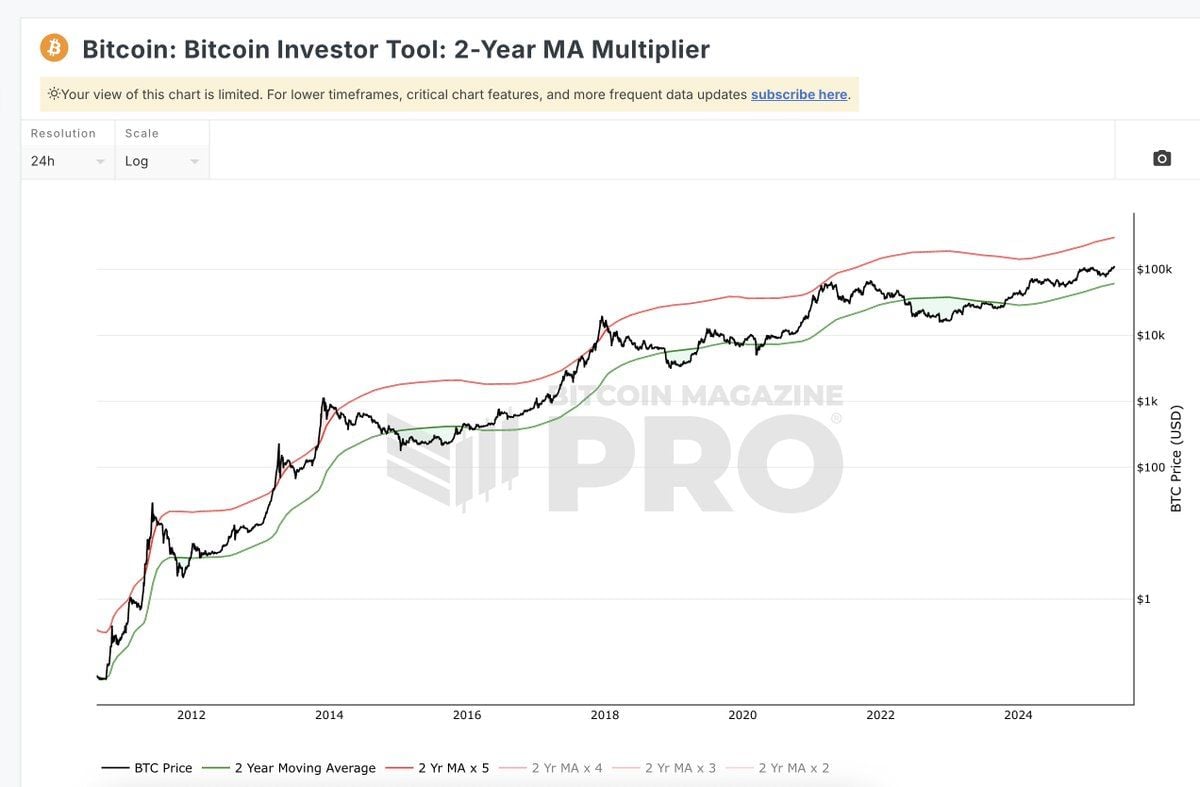 Source: Bitcoin Magazine Pro
5. Bitcoin Spot Retail Activity Shows Higher Potential
Data from CryptoQuant reveals that retail investors remain hesitant, with Bitcoin’s current trading volumes falling below the one-year average. This suggests that the market has yet to reach a “FOMO” (Fear of Missing Out) phase, typically observed during price peaks.
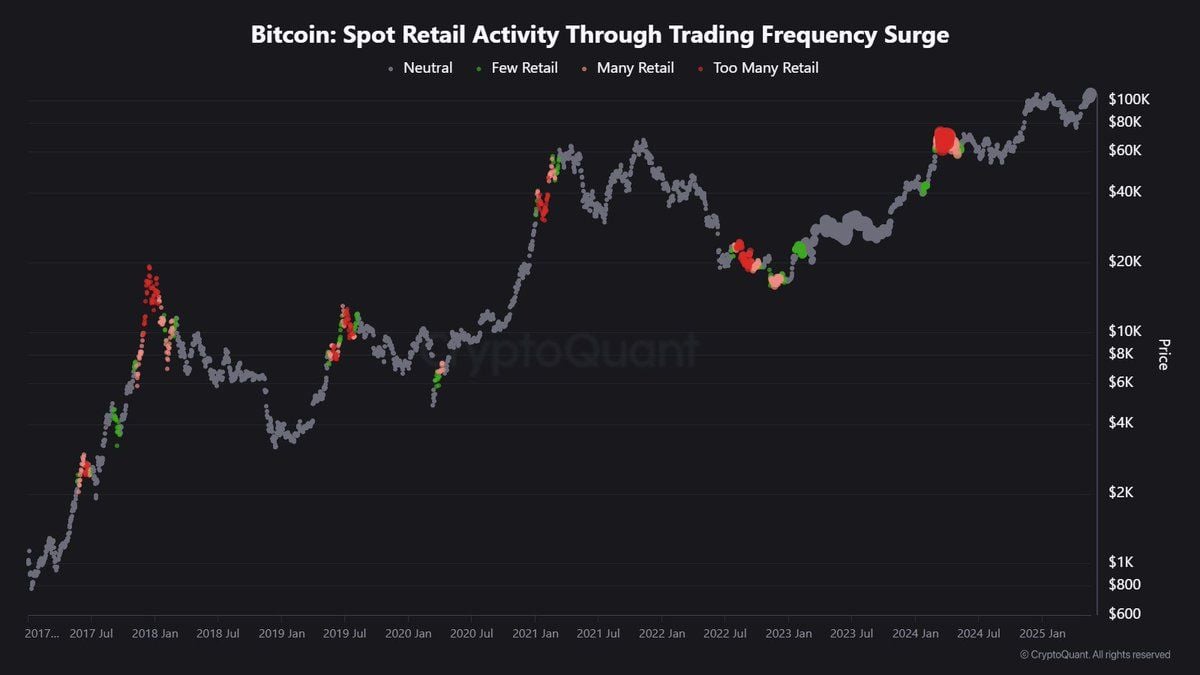 Source: CryptoQuant
A Bitcoin on-chain analyst at CryptoQuant also highlighted that recent corrections below $111,000 and $109,000 liquidated short-term holders employing excessive leverage. In contrast, long-term holders (LTHs) seized the opportunity to accumulate more Bitcoin during these dips, as highlighted in the previous report.


 English (US)