.png)
 14 hours ago
2
14 hours ago
2
ARTICLE AD BOX
Ethereum has experienced a sharp pullback, retracing over 10% since yesterday as the broader crypto market faced a wave of volatility. Despite the decline, bulls are showing resilience. ETH failed to break below the critical $2,300 mark and is now holding firm above $2,400, a sign that demand remains strong at current levels. Investors are watching closely as Ethereum consolidates and attempts to recover lost ground.
Top analyst M-Log1 shared a technical update indicating that ETH is currently sitting around the 200-period moving average on the 4-hour chart. This level often acts as a major trend indicator, and reclaiming it could spark renewed bullish momentum. According to M-Log1, Ethereum’s price action suggests a potential recovery toward the $2,600 zone, especially if bulls manage to push above the 50 and 100 MAs.
This renewed interest in ETH comes at a pivotal moment for altcoins. Many market participants are now evaluating whether this consolidation phase marks the beginning of a larger move for Ethereum and related assets. For now, all eyes remain on key technical levels as the market awaits confirmation of direction.
Ethereum Eyes Recovery After Market Shake-Up
Ethereum is showing signs of strength amid heightened market volatility sparked by rising tensions between Elon Musk and US President Donald Trump. The sharp war of words between the two high-profile figures triggered a wave of uncertainty in financial markets, prompting swift reactions across the cryptocurrency sector. While Bitcoin remains stable above the $100K level, altcoins have experienced significant pullbacks—ETH included. However, the coming weeks are shaping up to be decisive, with many investors closely watching for signs of recovery.
ETH has retraced over 10% in recent sessions but is now bouncing from the lows. Bulls appear confident as Ethereum holds above the $2,400 level and attempts to reclaim key moving averages on the 4-hour chart. According to M-Log1, ETH currently sits near the 200MA, a crucial technical level that often signals trend reversals. He notes that Ethereum is bouncing exactly as expected following last week’s broader altcoin correction.
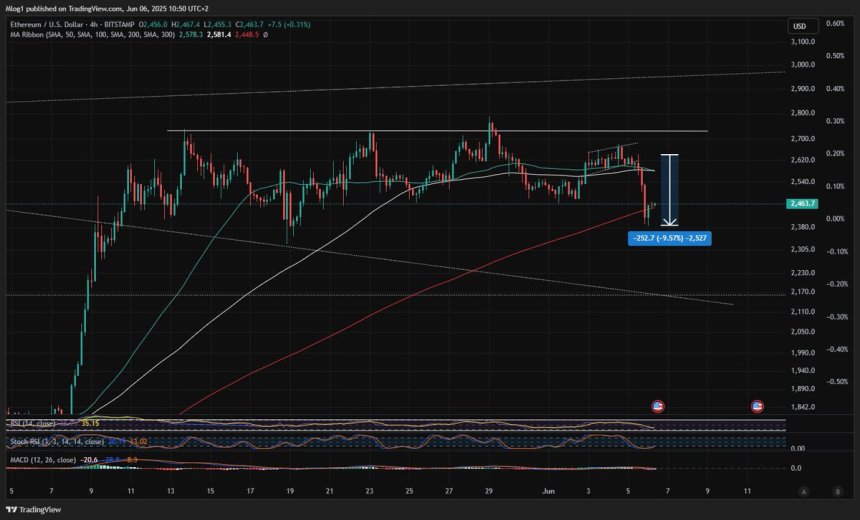
M-Log1’s analysis points to the $2,600 level as the next target. A successful push toward that zone, along with reclaiming the 50 and 100 moving averages, could set the stage for a strong rally throughout June. If ETH manages to build momentum and maintain support, the altcoin market could experience renewed bullish energy.
Despite ongoing macroeconomic uncertainty and political risk, Ethereum’s resilience is notable. With technical support holding and confidence slowly returning, the setup remains constructive, assuming bulls continue to defend key levels. As the market digests recent events, ETH’s price action over the next few days will offer critical insight into whether a new altseason can take off or whether further downside is still in play.
ETH Weekly Chart: Key Levels Hold
Ethereum is currently trading around $2,475 on the weekly chart, showing signs of hesitation as it faces strong resistance near the 200-week simple moving average (SMA) at $2,450. Although ETH managed to surge above this level briefly, the candle is showing rejection near the $2,680 area, which coincides with both historical resistance and the upper end of the 34-week EMA ($2,499). This confluence of resistance levels is proving to be a critical zone for bulls to reclaim.
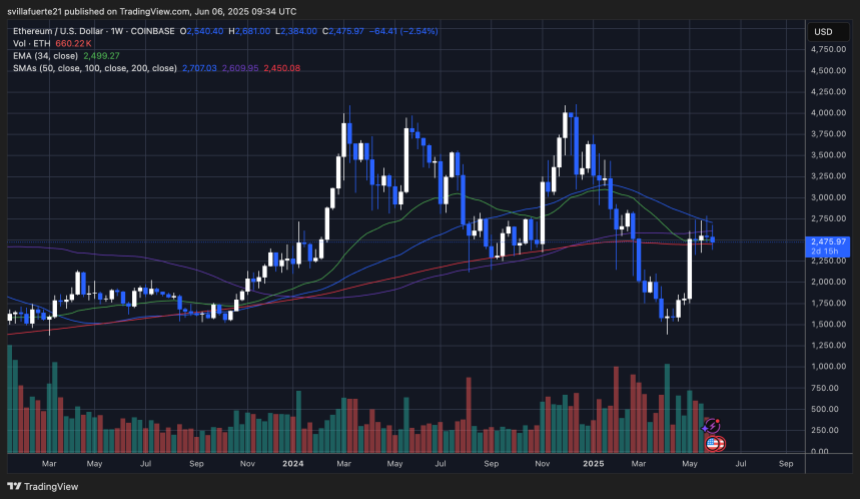
Despite the recent bounce from April lows, ETH is still struggling to gain bullish momentum on the higher timeframes. The last few candles reflect indecision, with long wicks and narrowing body size, suggesting that while buyers are defending downside levels, sellers remain active near resistance. If ETH fails to close the week above the 200-week SMA, a pullback toward the $2,300–$2,250 range is likely, which aligns with the 50-week and 100-week moving averages.
On the upside, a strong weekly close above $2,700 would be a major breakout signal, potentially triggering a broader altseason. For now, Ethereum’s weekly structure remains neutral-to-bullish, with consolidation above the 200-week SMA acting as a key battleground for trend confirmation.
Featured image from Dall-E, chart from TradingView


 English (US)