.png)
 4 hours ago
1
4 hours ago
1
ARTICLE AD BOX

- Ethereum is consolidating within an ascending triangle with a potential for a breakout toward $7,150 in the near term and $8,000 by early 2026.
- Despite recent gains, ETH’s MVRV Z-score remains below peak levels, indicating undervaluation.
Following its recent rally to $3,900, the Ethereum (ETH) price has seen some pullback and some volatility recently. As ETH continues to flirt around $3,750, market experts cite key on-chain metrics that could allow the rally to continue.
Institutional inflows in ETH remain strong, with BlackRock iShares Ethereum Trust (ETHA) driving most of the flows, as reported by CNF.
According to on-chain analyst Ali Martinez, the Ethereum network has added 170 new whale addresses, with wallets holding more than 10,000 ETH, over the past month. This increase is viewed as a strong indicator of growing institutional interest in Ethereum, particularly as the broader crypto market shows signs of renewed momentum.
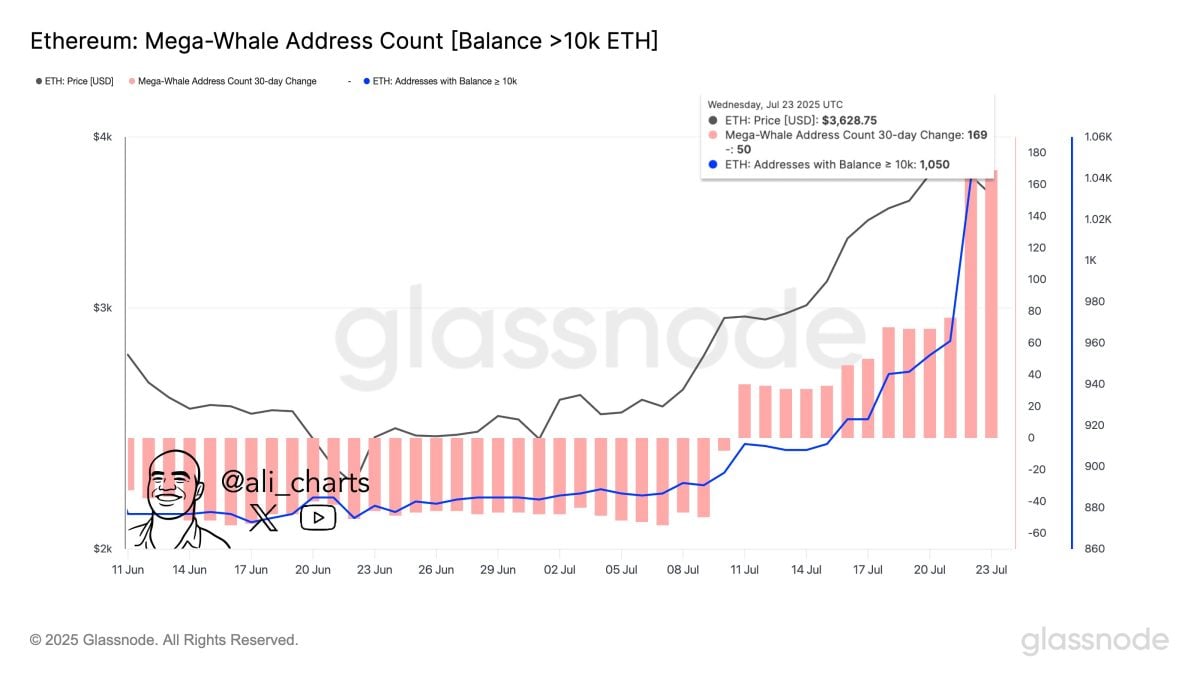 Source: Ali Martinez
Ethereum Price Targets $8,000 Following Dow Jones Trajectory
Crypto analyst Gert van Lagen has shared a striking similarity between ETH and Dow Jones, and expects ETH to rally to $8,000 from here. World Liberty Financial founder Eric Trump also shared the same ETH target, citing the global money expansion, as mentioned in our previous post.
At the core of Lagen’s analysis is a “textbook expanding diagonal” pattern—commonly known as a broadening megaphone formation. This technical structure features a widening price range, with the lower trendline consistently acting as strong support during Ethereum’s major rallies since mid-2022, including the 245% surge between November 2022 and February 2024.
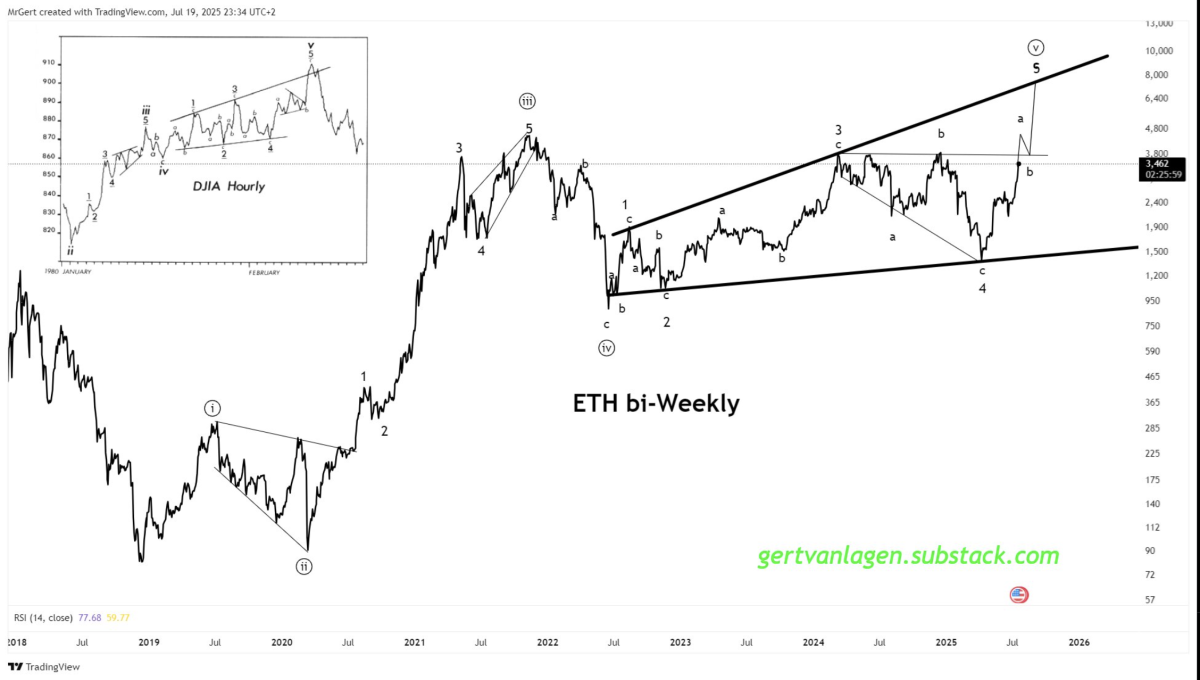 Source: Van Lagen
As shown in the image above, this chart pattern is exactly similar to the 1980s chart of the Dow Jones. On Monday, ETH was trading around the midpoint of its expanding diagonal pattern, having bounced off the lower trendline in March. It is now targeting a move toward the upper boundary of the pattern, which is projected to approach the $8,000 level by early 2026.
Two Charts That Show ETH Undervaluation and 80% Breakout
Despite recent price gains, Ethereum (ETH) continues to trail broader market sentiment. Data from Glassnode shows that ETH’s MVRV Z-score remains well below historical cycle peaks. While ETH has exited bearish territory, it is still far from levels that signal strong market euphoria.
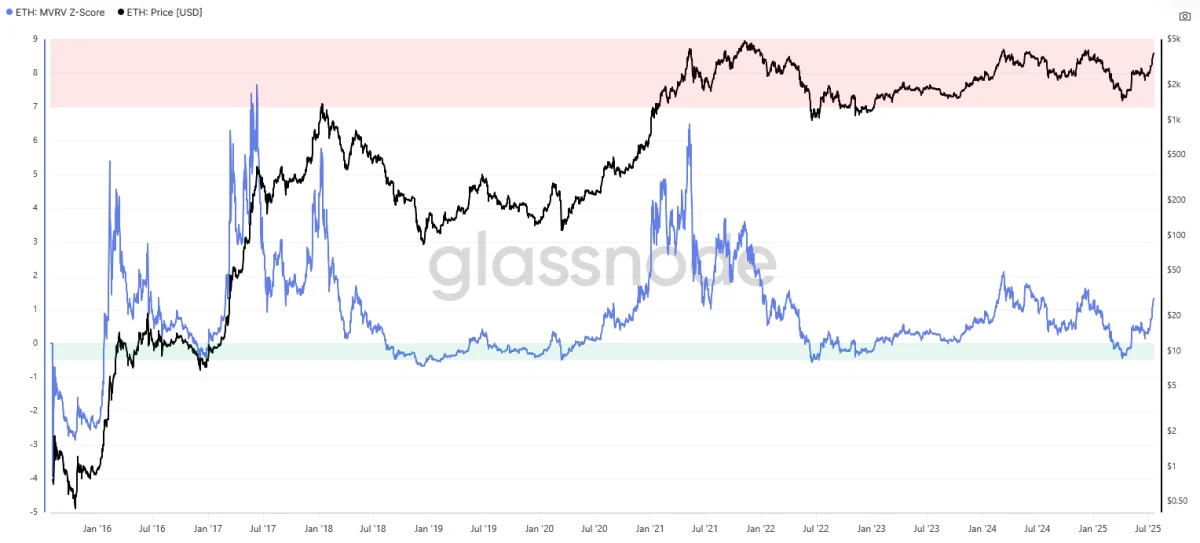 Source: Glassnode
ETH also lags significantly behind Bitcoin in relative performance. Over the past 12 months, BTC has surged 74%, whereas ETH has declined 28%, widening the gap between the two assets. In the near term, $4,000 stands as a crucial barrier for the ETH price. Breaking past this could set the stage for fresh all-time highs.
Ethereum’s price has reclaimed a multi-year ascending trendline as support and is now consolidating within a classic ascending triangle formation. The asset is currently testing the pattern’s horizontal resistance zone, which lies between $3,900 and $4,150.
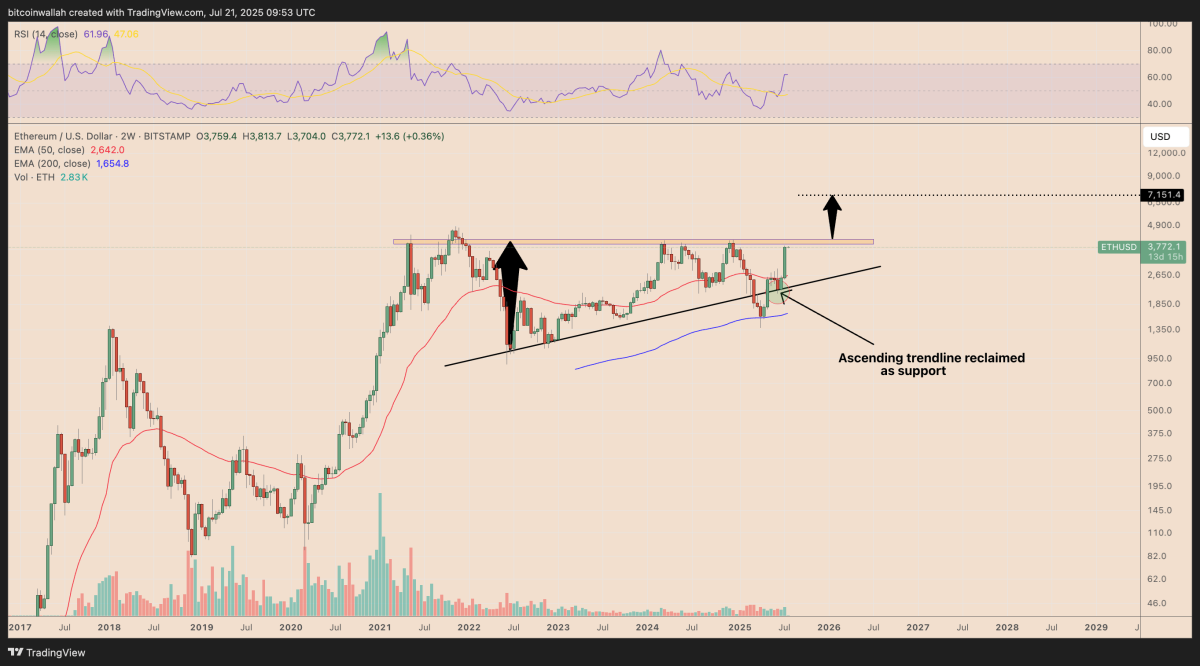 Source: TradingView
A breakout above the $3,900–$4,150 resistance range could pave the way for a measured move toward $7,150, hinting at a massive 80% upside from the current levels.


 English (US)