.png)
 12 hours ago
2
12 hours ago
2
ARTICLE AD BOX
The Dogecoin monthly chart has begun to echo the rhythmic, momentum-laden structures that prefaced each of the meme-coin’s historical breakouts, according to independent market technician Kevin, better known on X as @Kev_Capital_TA.
In a fresh publication dated 1 May 2025, Kevin notes that DOGE closed the April candle at $0.1795, up 4.2%, while defending two structural pillars he calls “the line in the sand”: the 0.382 Fibonacci retracement of the entire 2019-2021 advance at $0.1383 and the upper boundary of a 34-month falling wedge that originates at the May-2021 peak.
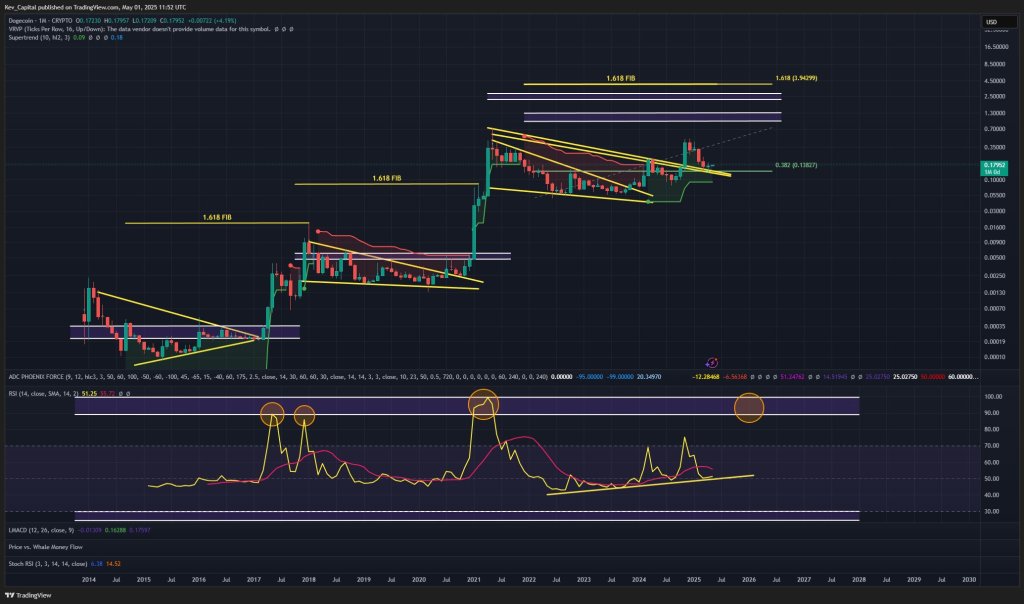
“DOGE held the macro .382 and the macro down-trending support that I labelled as the line in the sand and also stated was a phenomenal risk-reward opportunity,” Kevin wrote to his followers. “Monthly SuperTrend has not yet gone vertical in this cycle and the monthly RSI is at the same level it was at when DOGE was at 11 cents, with a ton of room to run to the upside. Ignore the short-term noise—the pathway is laid and it is time to start going down it.”
How High Can Dogecoin Price Go?
His chart reveals three wedge-shaped consolidations, each resolved by a vertical expansion that topped exactly at a 1.618 Fibonacci extension. The current wedge—drawn with parallel yellow trend-lines from the 2021 high—broke to the upside in November 2024, tagged $0.48, and is now being retested from above. Kevin stresses that “macro down-trending support” has so far responded as textbook support and therefore keeps the price structure constructive.
Horizontal liquidity bands, shaded in violet, cluster at $1.25–$1.35 and $2.40–$2.60, marking the first potential distribution zones of the new cycle. Directly above the highest of those bands sits Kevin’s ultimate Fibonacci projection, a 1.618 extension at $3.94. When a follower asked whether his targets still stand, Kevin replied: “Looks like I said $3.90 is unlikely and $1.80 is a stretch also but possible depending on how high BTC goes. Not really target-setting—just looks like I said if BTC goes really high then DOGE will too.”
Momentum gauges lend weight to his bullish narrative. The 14-period monthly Relative Strength Index, smoothed by a moving average, rests at 51.3—virtually identical to the reading seen in December 2020 when DOGE was trading at eleven cents. Previous cycle peaks, highlighted with orange circles on Kevin’s chart, all pierced the 90-point zone, implying what he calls “a ton of room to run.” The SuperTrend indicator has flipped positive but has “not yet gone vertical,” a condition Kevin interprets as latent rather than exhausted trend energy.
Supporting studies paint a similar picture: the long-term MACD printed its first positive histogram bar since 2021 in February and continues to climb, while Stochastic RSI sits at 6.4 / 14.5, near oversold territory—a configuration that preceded every prior parabolic burst once the gauge crossed north of 20.
Kevin embeds his technical view in a macro framework. “All the evidence I have—through charts and macro fundamentals—tells me we will likely find a durable top in BTC dominance in the May-July months,” he wrote in a separate thread. “First time in years I have been willing to say that, but the monetary policy is likely going to align with the charts soon and that is what I have been waiting for.” Pointing to the latest inflation data, he added:
Another leg back down for inflation, down to 1.35% on Truflation. Four rate cuts are projected for the rest of the year and quantitative tightening will be ending… The pathway is laid for the second half of the year for BTC and altcoins.”
At press time, DOGE traded at $0.179.


 English (US)