.png)
 4 months ago
6
4 months ago
6
ARTICLE AD BOX

- Bitcoin rebounds above $106K with rising momentum and targets $113K in the coming sessions.
- Ethereum rose by as high as 53% in Q2, as DeFi and institutional involvement expanded.
Middle East geopolitical tensions continue to escalate as the cryptocurrency market stabilizes following sharp weekend losses. Bitcoin, Ethereum, and XRP were all resilient, as they retested their local lows and recorded green candles on June 25. Though the world remains uncertain, institutional buying and the recessionary environment push recovery through better on-chain measurements.
Bitcoin (BTC)
Bitcoin had a sharp bounce mid-week, taking back some of the losses over the weekend, indicating a possible breakout. Following a fall under the $100,000 mark, BTC has rallied to $106,583 as of June 25. The trading volume, however, decreased significantly by 33% and stood at 45 billion. The market cap of Bitcoin is currently at 2.1 trillion.
BTC is technically experiencing a new bullish impetus. The RSI has increased to 55.34 with the MACD levels in convergence toward a possible crossing. Should bulls continue this momentum, a breakout above the $106K-107K level might give way to the next target at 113K. Continued bullish support is at around the $100K to $101K range.
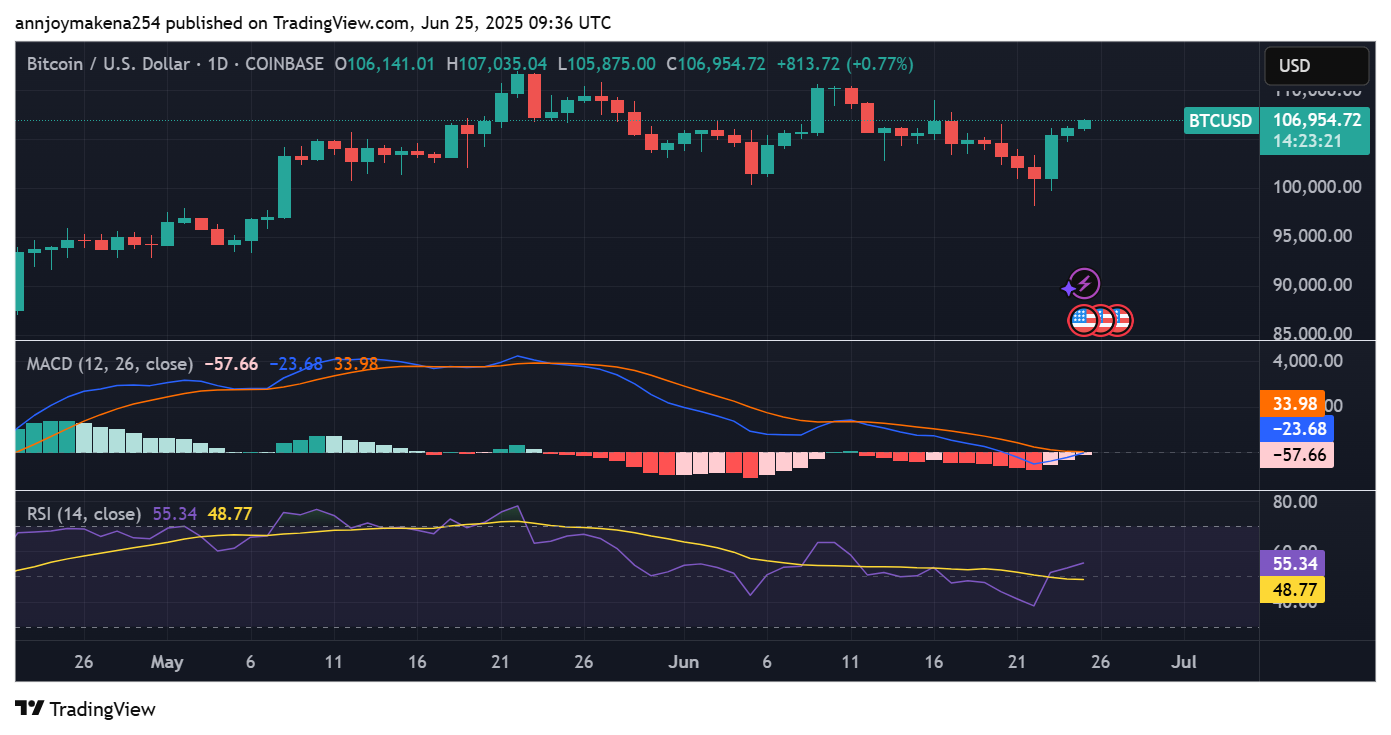 Source: Trading View
Bitcoin increased by 32.86% in Q2 2025. The demand is still driven by institutional accumulation in spot ETFs, and the overall asset under management of ETFs is projected to surpass $80 billion. Despite the external volatility, the BTC dominance index exceeded 64%, and the neutral market sentiment on the Fear & Greed Index can explain this metric.
Ethereum (ETH)
Ethereum outperformed Bitcoin throughout Q2 2025, rising between 39.9% and 53% following a steep decline in Q1. The rebound was a result of revived energy in decentralized finance (DeFi), surging institutional involvement, and augmented involvement in the network. ETH is now valued at $2421, dropping to a low of $2197 earlier this week.
Technical indicators favor an additional increase. The RSI stands at 46.58, and the MACD levels are exhibiting convergence indicators suggesting that the trend can be reversed soon. Near-term resistance stands at $2,547 and $3,000. Any sustained action beyond these new thresholds may result in a retest of $3200 in the early parts of Q3.
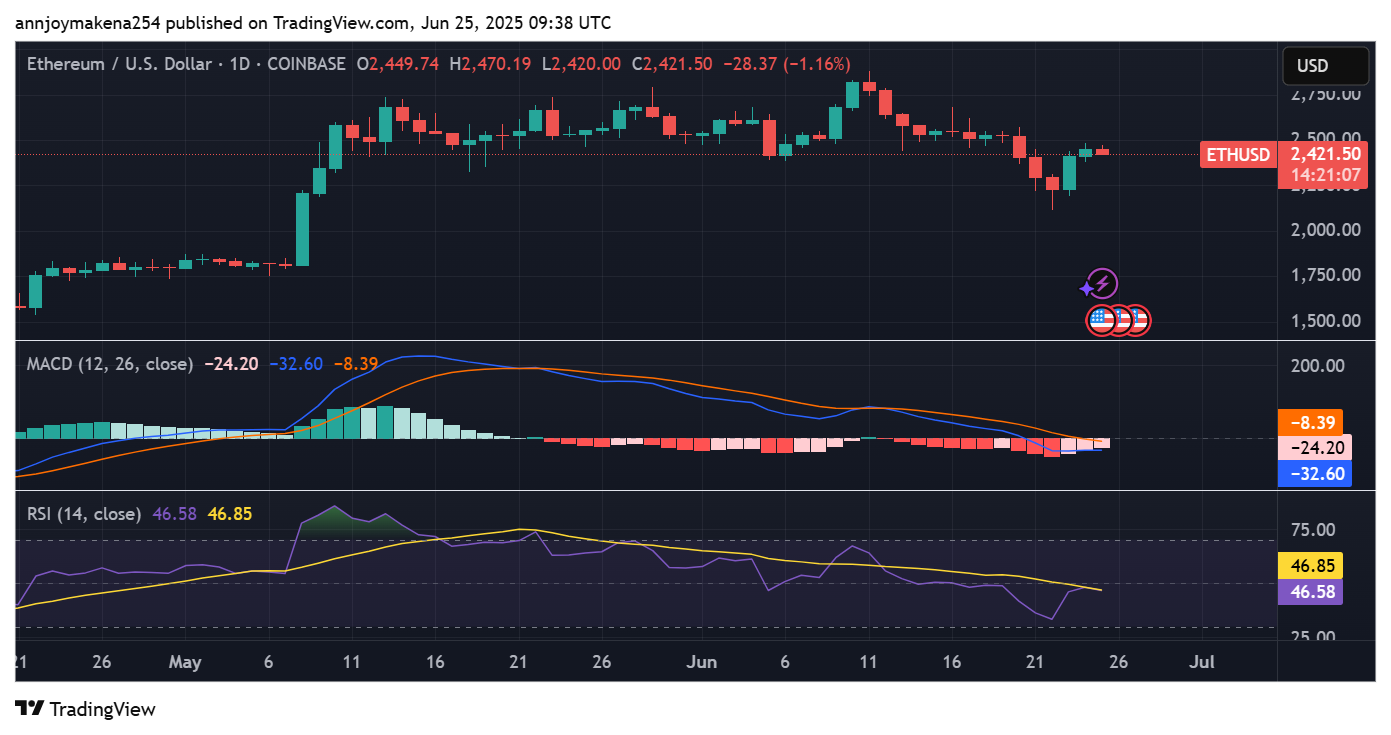 Source: Trading View
Ethereum recovery stands out in quarterly performance data. The open interest has been rising, and ETH is lifting the market out of its dip, with further growth anticipated. Analysts are eying the surge in ETH as a potential indicator of an altcoin rally, although confirmation is still not forthcoming.
XRP
XRP finished the second quarter on weaker footing, as its June loss wiped out any early positive performance. It is presently exchanging at $2.18 following a small bounce back at $1.94. The asset continues to trade weaker than resistance at the $2.23 level, despite a daily increase of 2% but a 45% drop in the trading volume.
The technical structure is mildly better. The RSI has moved to 49.42, and the MACD has crossed to positive with early bullish indicators. Even though XRP is trading above the 200-day SMA, it is still below the 50-day SMA, which it needs to break back through in order to continue making gains.
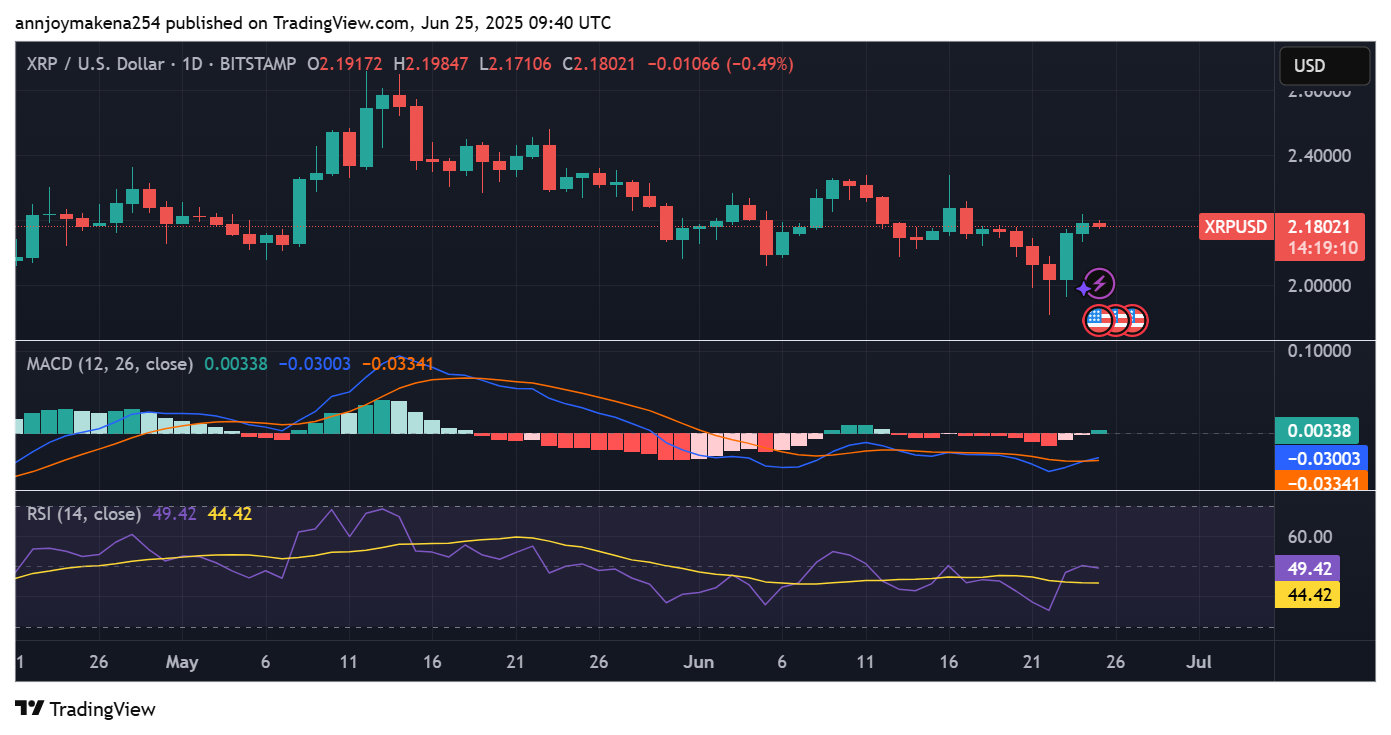 Source: Trading View
July historically is the best month in the history of XRP, with an average growth of approximately 8%. Should that pattern be repeated, XRP could regain some recent losses and head towards new highs. However, the traders are unconvinced and are waiting for better confirmation of price and volume behavior.


 English (US)