.png)
 1 day ago
1
1 day ago
1
ARTICLE AD BOX
- Bitcoin is being withdrawn from exchanges while market buy orders dominate, signaling a shift in trader sentiment.
- Rising USDT reserves show strong liquidity support, suggesting readiness for potential Bitcoin buying activity.
In recent days, an interesting trend has quietly begun to reshape the crypto market: Bitcoin is actually becoming less visible on exchanges. Data from on-chain analyst CryptoMe at CryptoQuant reveals that the BTC netflow chart on centralized exchanges has barely shown any green bars lately. This means that more Bitcoin is being withdrawn than sent in—and that’s no small signal.
In general, many people send BTC to exchanges to sell. So if they’re withdrawing, it could be a sign that they have no intention of selling anytime soon.
 Source: CryptoQuant
Bitcoin Sentiment Grows as Spot Liquidity Builds
Moreover, the volume of direct buy orders or market taker buys is actually dominating. This is clearly seen from the cumulative difference between buy and sell orders on the spot market. So, it’s not just that BTC is “disappearing,” but buying interest also appears to remain strong.
Furthermore, USDT reserves on exchanges are also increasing. Simply put: liquidity is there, capital is ready, just waiting for the right moment. It feels like many people are sitting back, their USDT wallets full, and their eyes on the screen, ready to press the buy button at any time.
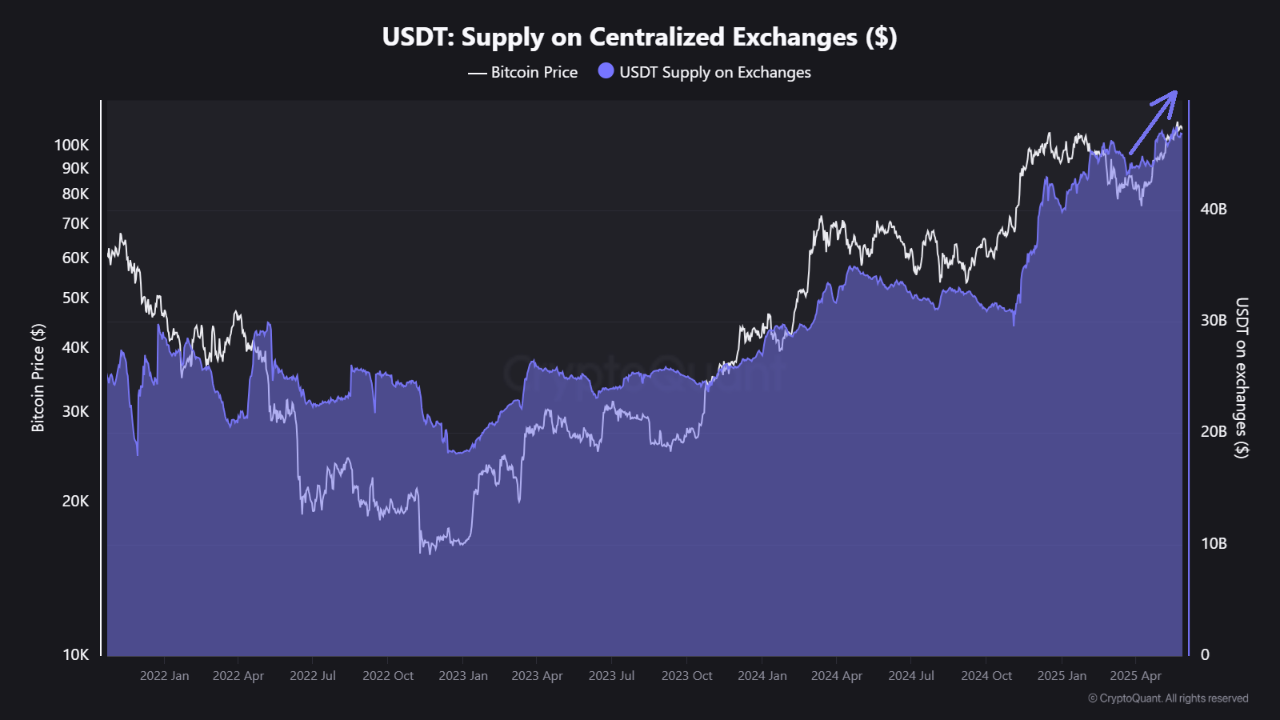 Source: CryptoQuant
However, it’s also important to remember that the spot market is not the only arena for Bitcoin to play. There are many other factors that play a big role—from ETFs, to OTC institutional buying, to derivatives markets like futures and options.
Even outside the crypto space, something as small as a comment from a political figure can suddenly change the direction of the wind. One sentence from the US president, for example, can turn the market upside down. But at least for now, signals from the spot market seem to be promising.
Be Careful, the Charts Are Not Entirely Friendly
While on-chain signals look promising, the technical outlook is a bit darker. CNF previously reported that BTC showed a double-top pattern, a formation that is usually considered a sign of price weakness. Not stopping there, trading volume also appears to be shrinking, strengthening the technical resistance that is currently being tested.
Amid the positive sentiment from netflow data, the average trader profit figure of 27% also needs to be observed. If this figure continues to rise and breaks through 40%, there is the potential for market conditions to become too hot or overheated. Like a body temperature that is already 37 degrees and continues to rise, that is not a good sign. Because usually, from that point, corrections can come at any time.
Meanwhile, the price of BTC when this article was written stood at about $105,527, down 2.26% in the last 24 hours. The transaction volume remains high, around $59.15 billion in a day, a figure that shows that market activity continues to run dynamically even though the direction is uncertain.


 English (US)