.png)
 1 day ago
1
1 day ago
1
ARTICLE AD BOX
- XRP forms a falling wedge and ascending triangle on different timeframes with a potential price breakout.
- Positive spot taker CVD data and bullish RSI divergence against Bitcoin suggest traders are accumulating XRP.
XRP price is showing strong signals that suggest a rally toward the $3 mark may be on the horizon. Notably, several technical and on-chain indicators are aligning to showcase this possibility. Many market participants point to recent price action and trader behavior to initiate the potential breakout.
Falling Wedge and Triangle Patterns Signal Major Move
In a recent post, we covered how Ripple (XRP) has sustained its dominant position in the cross-border payment space and carved a unique position in the cryptocurrency market. With this development in place, many market participants are more certain that a $3 mark is on the horizon.
The XRP price has formed two key bullish setups on its charts. First, the weekly timeframe reveals a falling wedge pattern, with resistance near $2.43. A weekly candle closing above this level could push the price to $3.20, marking a 45% jump from its current position of around $2.19.
 XRP Weekly Update | Source: TradingView
Falling wedges often signal a reversal. XRP has been moving within the wedge’s range, and its price remains above all major moving averages, which is usually a sign of strength. If it breaks out of the wedge, the next target will be clear.
It is worth noting that another pattern is forming on the daily chart. XRP is trading within an ascending triangle, a setup that typically ends in a breakout. The resistance is now pegged at $2.60. If price closes above this level, the triangle’s projected move could take XRP to $3.50, potentially a 60% increase.
This triangle followed a sharp recovery from $1.61 to $2.65. The price has stayed above $2 since April 11, suggesting a strong base is in place. However, as highlighted in our recent news brief, XRP showed serious bearish momentum on the RSI chart, reading 39, far below the neutral level of 50.
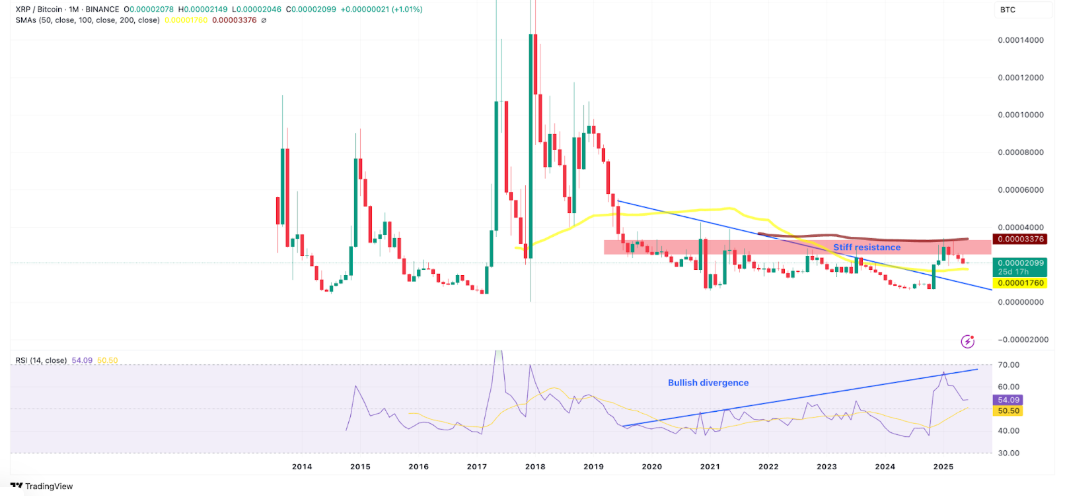
XRP/BTC Divergence And Strong Buy Pressure Strengthen
It is worth mentioning that the XRP/BTC pair also provides further support for a rally. Although the price of XRP in dollars has decreased since 2019, its Relative Strength Index (RSI) has been climbing.
This kind of divergence usually signals a weakening downtrend and a possible turnaround. It often means traders are buying during dips, expecting gains.
Currently, XRP/BTC faces resistance between 0.00002530 BTC and 0.00003375 BTC, which aligns with the 100-period moving average. If the pair breaks above this range, it could rise toward 0.00003609 BTC by June, a 71% move from current levels.
Another strong signal comes from spot taker CVD data. This shows the difference between buy and sell orders over 90 days. After a drop in early April, buying activity returned on May 19. Positive CVD means more buy orders are coming in, despite the market falling 17% since May 12. This steady demand could help XRP regain momentum and push higher.
With strong patterns and consistent buying pressure, the XRP price could be gearing up for a run toward $3 sooner than many expect. Currently, the coin is trading at $2.19, down 2.71%.
Beyond the price outlook, CNF previously covered that Chinese AI firm Webus has announced its plans to establish a strategic XRP reserve to facilitate cross-border payments seamlessly. This and other similar institutional embrace can form a net positive to fuel a price rally.


 English (US)